
Introduction
The Indian economy is driven by various transportation networks including aviation, railways, roads, and auto rickshaws, which play a crucial role in supporting the economic resilience of the lower-income segments. Auto rickshaws are particularly noteworthy for their affordability, accessible to every Indian citizen and notably to residents of Mysore. The advent of technologies such as (GPS)3 and satellite systems has facilitated the integration of new services like OLA,4 UBER,5 RAPIDO6 and others worldwide, akin to ‘Lyft in the United States’;7 ‘Grab’ 8in Southeast Asia like Didi Chuxing in China,9 ‘Careem’ in the Middle East,10 ‘Gojek in Indonesia,11 and Pathao in Bangladesh.12 These platforms offer ride-sharing options, including auto rickshaws, revolutionizing daily commute and navigation.
Technological advancements have spurred demand for easy access to auto rickshaws and efficient navigation,13 yet the impact on drivers' daily income remains uncertain due to a lack of precise data and statistical reports. Government and transport department studies, such as tax payment records and registrations with the Road Transport Office, aim to quantify the daily earnings of auto rickshaw drivers in Mysore.
The objectives the study is to examine how technology, specifically ride-hailing platforms like OLA, Uber, and Rapido, is influencing the daily operations and economic realities of auto rickshaw drivers in Mysore, To know how OLA, UBER, and RAPIDO platforms affect the daily earnings variability of auto rickshaw drivers in Mysore: This objective aims to investigate how the introduction and use of ride-hailing platforms impact the daily income fluctuations of auto rickshaw drivers. The focus is on understanding whether these platforms provide a stable source of income or if they introduce uncertainty. It would explore if drivers earn more or less depending on the demand for these services, peak hours, and the competition among drivers using the same platforms. Efficient route planning may also result in less fuel consumption, boosting profitability. By looking at policy ramifications, regulatory issues, and broader public advantages, the research not only explores the operational aspects but also the legal and societal implications of these technological shifts. Investigating the way online platforms (OLA, UBER, RAPIDO) charge commissions could reveal how these fees affect driver earnings. For example, traditional auto rickshaw drivers often negotiate fares directly with passengers, but online platforms typically charge a fixed percentage of the fare as commission. The study could analyze how these commission structures impact drivers' income stability and how it compares to traditional pricing models. An interesting angle here would be whether drivers have to work more hours to maintain the same level of earnings due to higher commission deductions. Public Advantages increases accessibility to transportation through apps like OLA and UBER is likely improving convenience for many passengers, especially tourists who may not be familiar with the city's local transport system. This could lead to more equitable transportation opportunities, with benefits for people with limited mobility, lower-income individuals, or tourists who find it difficult to negotiate prices with traditional drivers. Additionally, evaluating the effect on overall transit efficiency is important. For example, the availability of app-based ride-hailing services might decrease wait times and reduce congestion in popular areas, improving the flow of traffic. By analyzing wage records and trip data, you could gather data on how often drivers are on the road, the earnings they generate, and the overall demand trends for both traditional and app-based services. This data would offer objective insights into the economic impact of these platforms. Interviews and focus groups would add a human element, providing in-depth perspectives on how drivers feel about the shift to app-based services and how they perceive the regulatory changes. This approach would also be valuable for capturing public opinion on whether these new services are perceived as beneficial or problematic.The study could conclude with policy recommendations based on the findings, potentially advising on how the government can support the integration of technology while ensuring fairness and transparency for all stakeholders. For example, guidelines on commission rates, the licensing process, or how to integrate local auto rickshaws into the tech-driven economy.When conducting research on the daily wages of auto rickshaw drivers, several limitations can impact the reliability and conclusions of the study.
A major concern is data reliability and availability, as obtaining accurate and comprehensive data on drivers' earnings can be difficult. Governmental studies and transportation department reports may provide insights, but these sources are often subject to gaps, discrepancies, or outdated information. For instance, they may report averages or aggregated statistics that fail to account for the wide variance in earnings across different drivers, regions, or time periods. Many auto rickshaw drivers also operate informally, meaning their earnings may not be captured in official data, leading to discrepancies between reported and actual wages. Sample size and representativeness also pose challenges. To ensure meaningful analysis, the sample must be large and diverse enough to reflect the full spectrum of drivers in Mysore. However, some groups, like part-time drivers or those working in less populated areas may be underrepresented, which could result in biased findings that don’t accurately reflect the experiences of the broader driver population. Selection bias further complicates matters, as drivers who are more successful or rely on ride-hailing apps like Ola or Uber may be more likely to participate in the study, skewing the results toward higher earnings and technological influences, and excluding those who rely on traditional, non-tech-driven incomes. Temporal factors also affect the study's reliability. Rapid technological advancements, changes in regulations, and shifts in the economy can all influence earnings, and the timing of data collection may limit the relevance of findings. For example, a study conducted during an economic boom or specific technological period might not reflect long-term trends or recent changes, such as the rise of ride-sharing platforms. Additionally, determining causality versus correlation is challenging. While there may be correlations between the use of technologies like Ola and Uber and fluctuations in earnings, proving a direct cause-and-effect relationship is difficult, as many factors—such as fuel prices, competition, and demand—also contribute to income instability. The comparative analysis of qualitative and quantitative data is another obstacle, as integrating subjective driver perceptions with objective earnings data can be challenging. While qualitative data offers insights into drivers' experiences and views on technology, quantitative data provides hard numbers, and comparing these two types of information requires careful interpretation.
(A) Significance of the Study
In the era of technology to think on how technical innovations like GPS systems and ride-sharing services (OLA, UBER, RAPIDO) impact driver wages and overall income stability, this study examines the economic and technological factors influencing the auto rickshaw sector in Mysore. Because they provide an accessible and reasonably priced mode of transportation, auto rickshaws are essential to the mobility of Mysore's lower-income groups. Given their economic importance, it is essential to comprehend how technological integration affects them in order to guarantee resilient lives and economic stability. The integration of GPS and ride-sharing platforms has significantly transformed the auto rickshaw sector by enhancing route optimization, improving customer acquisition, and increasing productivity. However, these advancements also bring challenges, particularly regarding income variability. This study investigates factors such as fluctuating demand, commission payments, and platform pricing mechanisms, which contribute to unstable earnings for drivers. Additionally, the study evaluates the broader socioeconomic impact, examining how these technological changes benefit the public by improving access to transportation and saving time, while also considering the drawbacks, such as rising fuel prices and platform commissions that reduce drivers' net income.
(B) Review of Literature
• Massimo Bovenzi, September 2010, A Longitudinal Study of Low Back Pain and Daily Vibration Exposure in Professional Drivers14
Professional drivers exposed to whole-body vibration (WBV) from operating machinery or vehicles in various sectors face a heightened risk of developing back problems, including low back pain, herniated discs, and early spinal degeneration. Studies consistently highlight these risks compared to non-exposed worker groups and the general population. Additionally, driving involves ergonomic factors like prolonged sitting and awkward postures, compounding stress on the spine.
• A. MANI, MADHAV PAI, R 2012. AGGARWAL, SUSTAINABLE URBAN TRANSPORT IN INDIA: ROLE OF THE AUTO-RICKSHAW SECTOR.15
India's need for urban transportation is growing, and with it, so is the popularity of auto-rickshaws. From 2003 to 2010, the number of these motorized three-wheelers produced doubled, a sign of their growing demand. The majority of motorized excursions in major Indian cities are taken by auto-rickshaws. Any successful plan to improve urban transportation must acknowledge this industry's critical role. This study examines the various ways in which India's auto-rickshaw industry might support sustainable transportation in cities. It provides suggestions for reforms to directly address issues related to sustainability and offers a framework for policy intended for maximizing the sector's potential.
• P. Starkey, 2014 The Expansion Of Three-Wheeler Transport Services: The Case Of Qingqis In Pakistan16
In both Europe and the US, motorcycle produce grew gradually in the early 1900s. Three-wheeled vehicles, such as those with sidecars and different wheel layouts, appeared alongside motorcycles. Because of their dependability, sidecar-equipped motorcycles acquired popularity and were frequently utilized by the military, notably as ambulances in World War I. Although three-wheelers were utilized for personal transportation and urban freight, they were not frequently used as public transportation vehicles.
• Saurabh Kumar, June 2014, A Study on Auto-Rickshaw Users and Drivers Characteristics in Patna,17
Auto-rickshaws are crucial for Patna's traffic system, the largest city in Bihar. Their numbers have grown rapidly over the years. Introduced in India in the late 1950s, auto-rickshaws have become indispensable for urban transport, accommodating between 5 to 10 passengers. They are powered by low-horsepower 2 or 4-stroke engines and typically carry two or three adults besides the driver. These vehicles feature a canvas-covered frame with the engine mounted at the back.
• Khatana, K. J. (2015). Role of the three wheeler auto vehicle in promoting sustainable urban transport in Pakistan.18
Transportation plays a crucial role in connecting individuals with essential resources needed for their full development, as highlighted by Gonzalez et al. (2019). In rural areas, where populations and activities are widely dispersed, daily travel often involves covering significant distances. Access to transportation becomes indispensable for reaching work, education, healthcare, shopping, and recreational facilities, as noted by Noack (2011). For those without personal transport, travel options are limited to walking or relying on available transport services. This dependency underscores the critical role of transportation in enabling access, especially in rural settings, addressing the specific needs of women, and supporting development in less economically advantaged regions. Research indicates that inadequate transport infrastructure disproportionately affects rural women and school-age girls, impacting their access to essential services (Fernando and Porter, 2002; Porter, 2013).
• Anitha Ramachander, Chaya Bagrecha, Sumangala Talur 2015 "Financial Well-beingof Auto Drivers in Bangalore - A Study Conducted under Research Promotion SchemeofAICTE".19
According to the study, the drivers are from economically disadvantagedbackgrounds, and most of them are uneducated. Their savings are minimal, and their typical incomes barely cover both ends. Also mentions their health difficulties. focuses onthedriver's financial and educational status, as well as their way of living.
• Rajesh Ranjan. 2015 "A Study on Work-Life Balance of Auto Rickshaw Drivers in Mumbai"20
This study gave a detailed look into the daily life of auto-rickshaw drivers. Genuinely maintaining a work-life balance is challenging in any sector, but auto drivers find it especially. According to the study, most auto-rickshaw drivers had difficulty balancing their employment and family/personal lives.
• Tiwari, G., Jain, D., & Rao, K. R. (2016).21 Impact of public transport and non-motorized transport infrastructure on travel mode shares, energy, emissions and safety: Case of Indian cities. Transportation Research. Part D, Transport and Environment, 44, 277-291.
In this study, we look at how New Delhi's auto-rickshaw and taxi drivers are affected by ride-sharing services like Ola and Uber. Using a mixed-methods approach with sixty drivers, we discovered a range of impacts but no discernible overall gains. Drivers may have made between 7 and 18% more money per day, even though there was no statistically significant increase in average daily revenue. This is mostly because they worked longer hours. Our research shows that, in spite of company assertions of flexibility and autonomy, drivers feel less in control. Additionally, drivers' compensation is unpredictable because ride-sharing businesses occasionally give promotional incentives
• Auto-rickshaws in Indian cities Public perceptions and operational realities November 2016
India has the majority of the world's auto-rickshaws, crucial for urban transport due to their versatility and cost-effectiveness compared to taxis, serving a wide range of trip needs that other public transport cannot meet practically.
• Jn, N. (2017). A case study of barriers to digital financial inclusion of Auto-Rickshaw drivers in Viman Nagar, Pune, Maharashtra. Journal of Political Science & Public Affairs, 05(03).22
The author in his study states hat India's post-demonetization landscape, which went into effect on November 8, 2016, whereas the said work examines the government's changed goals by prioritizing the promotion of a cashless economy took precedence over the initial goal of decreasing black money. By promoting digital transactions and offering incentives for their adoption. This change emphasized how vital financial inclusion is to the realization of a cashless economy. The assessment focuses on how these policy adjustments attempted to alter India's economic environment by putting more of an emphasis on digital transactions and giving more people access to finance.
• Sayoojkumar K.P. 2017 A study was conducted on the "socioeconomic and healthstatusof auto-rickshaw drivers in the Calicut area".23
The study of auto drivers reveals a tremendous impact on their socio-economic and health perspectives. According to the research, the socioeconomic status of Calicut city's auto drivers is average. They fall under the lower middle-class category. They are dissatisfied with the government's assistance plan, and many are unaware of the government's welfare scheme. The vast majority of drivers have no savings habits.
• M Yesurajan and Dr. T. Indra. 2017 "Common work-related health problems of autorickshaw drivers in India - Causes and strategies"24
According to this study, the focus is on driver health difficulties, among other things. Many drivers are still unaware of their health. Because of their strain and stress, auto-rickshaw drivers have the lowest health outcomes. Asa result, most drivers developed unhealthy practices to relieve tension, which negatively impacted vehicle drivers' health. As a result, it is proposed that the government seek information on how to improve the health, knowledge, and wellness of automobile drivers
• Kashyap, R., & Bhatia, A. (2018). Taxi drivers and taxidars: A case study of Uber and OLA in Delhi. Journal of Developing Societies, 34(2), 169-194.25
According to the him, India's sharing economy is still in its infancy, with optimism being stoked by elements such as a young population, high mobile phone usage, and broad internet access (Gururaj, 2015; Chandrasekhar, Ghosh, & Roy Choudhary, 2006). Sharing is viewed as a helpful cultural trait that helps with infrastructure issues by encouraging cooperative consumption (Doley, 2015). It is anticipated that this economic paradigm will change entrepreneurship, work, and production, thereby advancing India's socioeconomic development.
• Melwani V, Priya A, Toppo M, Sethia S, Khan A, Melwani S. 2018 "Study to assess the socio-demographic profile, health status and working conditions of auto-rickshaw drivers in Bhopal".
This study was conducted on the various circumstances of auto drivers. This study reveals that drivers experience health difficulties such as back discomfort and neck pain. It also asserts that as auto rickshaw drivers make up a significant portion of the public transportation system, the government should increase their social security through a variety of programs.
• Melwani et al. (2018) studied to assess the socio-demographic profile, health status and working conditions of auto-rickshaw drivers in Bhopal and conclude that Health related issues like backache,26 neck pain and headache elucidates occupational health hazard in auto rickshaw drivers due to vibrations arising due to driving and sitting for prolonged hours while driving and waiting for customers. In this era where everything is expected in an instant, transportation system needs to be improved. Auto rickshaw drivers form a broad part of public transport systems, providing them social security through various schemes should be an essential venture of the government.
• Jithu T.V. 2019 "Empowerment through Employment: A Study among the Women Auto-Rickshaw Drivers"27
In most sectors of the labour market, women are paid less than males. However, in the transportation industry, particularly in vehicle driving, women are paid on par with males. The payment is determined only by the distance and time of the journey to the destination. This industry provides equal employment possibilities for men and women.
• Kashyap, R., & Bhatia, A. (2018). Taxi drivers and taxidars: A case study of Uber and OLA in Delhi. Journal of Developing Societies, 34(2), 169-194.28
According to the him, India's sharing economy is still in its infancy, with optimism being stoked by elements such as a young population, high mobile phone usage, and broad internet access (Gururaj, 2015; Chandrasekhar, Ghosh, & Roy choudhary, 2006). Sharing is viewed as a helpful cultural trait that helps with infrastructure issues by encouraging cooperative consumption (Doley, 2015). It is anticipated that this economic paradigm will change entrepreneurship, work, and production, thereby advancing India's socioeconomic development.
• Anirvinna, C., & Deshmukh, A. K. (2019b). Pricing strategy of cab aggregators in India. Journal of Revenue and Pricing Management, 19(4), 248-254.29
In the current global environment, businesses are using cutting-edge technology more and more to reinvent traditional services and give clients creative new methods to access them. An important illustration of this is the online taxi booking system, best represented by Uber, which started in the USA in 2009 and is now active in 72 countries, including India. The popularity of auto rickshaws, which are not just a means of transportation but also a cultural icon in India, makes this expansion more nota.
• Dr. Vikram K. Joshi. 2020 "Empirical Study Of Technology Based Auto-Rickshaw Service Quality Perception Using SSTQUAL"(SSTQUAL,30 or Service System Transition Quality, is the perception of quality during a service system's transition period. It refers to the quality experienced by consumers or users when a service system undergoes a significant change, such as the implementation of new technology, the modification of processes, or the introduction of new service features.)
According to the study, both service providers are performing well when it comes to providing technology-based auto booking services to their consumers. According to the analysis, Uber outperformed its opponent in terms of average customer satisfaction, enjoyment, personalization, functionality, security, and assurance. consumers of Uber regarded its apps to be the most pleasant and customized.
• Chougule, P. S. (November 2020). A STUDY THE PROBLEMS OF AUTO RICKSHAW.31
India's auto rickshaw drivers have difficult lives; they toil day and night to provide for their families. Many rely on loans or rentals since they cannot afford to buy their own cars. They work very hard, but their pay is frequently insufficient. They frequently deal with issues like arguing over fees and try to maximize their profits by transporting a number of passengers, which can exacerbate traffic jams. Their daily schedule of waiting at intersections emphasizes the difficult reality of their jobs.
• Dr. P. Ponraj, M. Sankara Narayanan. 2020 "Share Auto Rickshaw Transport Service". 32
The study discusses the social and economic backgrounds of auto drivers, as well as their job happiness. It is stated that auto drivers constitute the backbone of this kind of transportation
• Tigari, H., & Santhosh, H. B. (2020). Socio-Economic background of Auto-Rickshaw drivers. Shanlax International Journal of Management/Shanlax International Journal of Management, 8(1), 48-53.
In expanding Indian cities, auto rickshaws are an essential part of urban transportation, as discussed in Tigari (July 2020). According to this definition, an auto rickshaw is a chauffeured vehicle that passengers hire and use to go to and from destinations of their choosing. In contrast, pick-up and drop-off locations for other modes of transportation are set.
• Prakash s. Chougule, a study the problems of auto rickshaw drivers in kolhapur city using statistical tools and techniques, volume: 6 | issue: 11 | November 2020,33
According to his research, most urban drivers are married, have modest residences, and drive cars. They prioritize getting family and auto insurance, and they prefer the rickshaws made by Bajaj Auto. They also regularly finance their auto rickshaws using bank loans, usually from the Central Bank. Most of them own a car, and their monthly salary normally falls between Rs. 7000 and Rs. 10,000.
Auto drivers use gasoline and gas as their main fuels and put in long workdays-often more than eight. Generally, they do not use smartphones or stay up to date with technology changes while waiting for passengers, which can take up to two hours.
• Sarannya Sivasankaran, Poornima. 2022) "A Study on Job Satisfaction of Auto Drivers with Special Reference to Coimbatore District" 34
The study discusses job satisfaction and the issues that auto-rickshaw drivers face every day. The study reveals that auto drivers are dissatisfied with their jobs. Their socioeconomic situation is inadequate. They are dissatisfied with their current earnings. The majority of respondents are unable to save money because they do not earn enough to cover both ends of the income scale. Mention their health difficulties as well.
• Dr. Noor Firdoos Jahan, Auto Drivers' Preferences towards leading Ride Hailing Companies in Bangalore, Vol 13, Issue 3 (2023)35
These services, highlighted by experts at Fact. MR, provide a convenient and cost-effective transport option compared to private vehicle ownership, driving market expansion. India's strong economic growth has created numerous job opportunities in metro and Tier 1 cities. Despite challenges in urban mobility due to rural migration, many urban dwellers rely on ride-hailing services like Rapido, Ola, and Uber, which have expanded from bike taxis to auto services, meeting diverse transportation needs effectively.
• Mohamoud, A. (2023-12-19). The role of Auto rickshaw drivers on income performance among society in Banadir region-Mogadishu-Somalia.36
In this article, The growing population growth-related pressure on transportation networks is covered in this overview of the literature. It emphasizes auto rickshaws as an alternative to private automobiles and as essential for connecting door-to-door services and public transportation.
Conceptual Background of Auto Rickshaw
In cities like Mysore, auto rickshaws also called tuk-tuks in some areas—are essential for peri-urban and urban mobility since they are accessible and reasonably priced, especially for lower-class individuals. With the addition of GPS and satellite technologies, they have undergone a substantial evolution from their manual operation in the past. These technologies have been used by platforms like OLA, UBER, and RAPIDO to provide ride-sharing services, increasing productivity and reaching new markets.
Auto rickshaw drivers' sources of income have changed as a result of these technological platforms, which provide advantages like enhanced accessibility, better navigation, and prospective pay increases. However, there are still issues, such as erratic demand, platform-controlled pricing dynamics, and growing operating expenses like commissions and fuel. It is essential to comprehend these effects in order to guarantee economic sustainability. Although ride-sharing services and GPS increase accessibility and productivity, they also present socioeconomic problems. By addressing these problems with well-informed policy and business practices, we can maximize the benefits of increased urban mobility for society while guaranteeing drivers' sustainable means of subsistence.
Factors Influencing Auto Rikshaw Driver’s Daily Income
Several factors influence the daily income of auto rickshaw drivers, starting with demand and supply dynamics.37 Seasonal variations play a key role, as demand for auto rickshaws can fluctuate depending on the time of year, such as increased tourism during peak seasons. The time of day also affects earnings, with peak hours (morning and evening rush) yielding higher fares compared to quieter periods. Additionally, location is crucial drivers operating in busy areas or near transportation hubs like train stations or airports typically experience higher demand and, consequently, higher earnings. Another significant factor is fares and pricing. A driver's ability to negotiate fares can directly impact their income, as some drivers are more skilled in securing better rates. Government-imposed pricing regulations also influence how much drivers can charge, with fare structures often set by local authorities, limiting pricing flexibility. Operational costs are another major consideration, as fluctuating fuel prices can significantly affect profitability, while regular maintenance costs for the vehicle reduce the overall income that drivers take home. Maintaining operational efficiency, such as planning routes effectively and minimizing idle time, can help increase the number of rides and boost earnings. The rise of technological integration has also had a significant impact. Using ride-sharing platforms like Ola or Uber offers drivers access to a broader customer base, although commission fees reduce their net income. Additionally, the use of GPS and navigation systems helps drivers optimize routes, reducing fuel consumption and improving profitability. The competitive landscape also affects daily earnings, as the availability of alternative transportation options such as buses or private vehicles can reduce demand for auto rickshaws. Finally, emerging market trends, including shifts in consumer preferences or the introduction of new transportation solutions, can influence the demand for auto rickshaws, affecting their daily income potential.
Satisfaction of Ride- Sharing Apps for Auto Rickshaw Drivers
Auto rickshaw drivers in cities like Mysore experience a mix of satisfaction and challenges due to technological advancements and the integration of ride-sharing platforms such as OLA, UBER, and RAPIDO. These platforms have significantly transformed the auto rickshaw industry by improving accessibility and navigation through GPS technology. This has enhanced drivers' ability to optimize routes and attract more customers, potentially increasing their productivity and earnings
However, alongside these benefits come several challenges. One major issue is the unpredictability of demand, which can fluctuate due to various factors like time of day or seasonal changes. The introduction of dynamic pricing by platforms also poses a challenge, affecting how much drivers earn per ride. Moreover, drivers face increasing operational expenses such as fuel costs and platform commissions, which can eat into their overall income.
From a socioeconomic perspective, auto rickshaws remain crucial for providing affordable transportation options, particularly benefiting lower-income populations in urban areas like Mysore. The integration of technology has not only improved mobility but also introduced new economic opportunities for drivers, albeit with complexities that require careful management.
Table 1: Auto Rickshaw Driver’s Age, Gender
| Age Group | Gender | ||
|---|---|---|---|
| Male | Female | Total | |
| Between 18-30 years | 24 | 02 | 26 |
| Between 30-45 Years | 38 | 07 | 45 |
| Between 45 & above | 26 | 03 | 29 |
Graph 1: Auto Rickshaw Driver’s Age, Gender
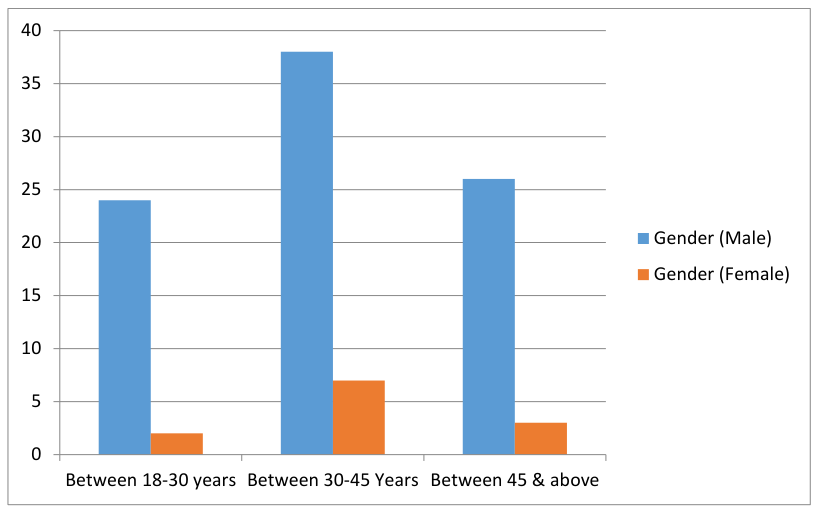
The demographic analysis of auto rickshaw drivers in Mysore highlights key age and gender trends. The largest age group is 30-45 years, with 45 drivers, suggesting they are in their prime working years, combining experience and physical ability. Males consistently outnumber females across all age groups, with the highest proportion of males in the 18-30 years group, reflecting greater access to informal employment for men. The 45 and above age group is the smallest, possibly due to physical limitations or retirement. The 30-45 years group shows the largest gender gap, with 38 males and only 7 females, indicating cultural and societal barriers that limit women's participation in this profession. These trends reveal significant gender and age disparities, with males overwhelmingly dominating the profession and fewer older individuals continuing in the field. The integration of technology through platforms like OLA, UBER and RAPIDO blurs the line between traditional and technology-driven income streams for auto rickshaw drivers. This study seeks to explore income variability and assess how technology aids auto rickshaws, while acknowledging the broader public benefit of enhanced access and time-saving transportation solutions. Despite rising fuel costs and commission payments to platform operators, the fundamental question remains regarding the sustainable income of auto rickshaw drivers amidst these technological advancements.
Table 2: Table on:- Auto Rickshaw Driver’s Age group
Table 3: Table on:- Usage of Apps and
Table 4 Table on :- Usage of Smart Phones.
| Age Group | Usage of Smart phones | Usage of Apps | ||||||
|---|---|---|---|---|---|---|---|---|
| between 18-30 years | Between 30-45 | Between 45 & above | Yes | No | Only OLA | Only UBER | Only RAPIDO |
ALL three |
| 26 people | 45 people | 29 people | 82 | 18 | 17 | 15 | - | 50 |
Graph 2, 3 &4: Auto Rickshaw Driver’s Smart Phones and Usages of Apps.
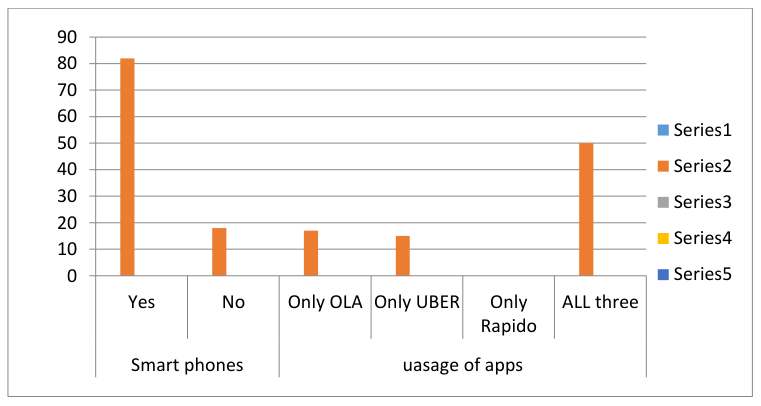
In the surveyed population, 82 out of 100 people use smartphones, indicating high smartphone penetration. RAPIDO stands out as the most popular ride-hailing app, with 50 users exclusively using it, likely due to its focus on motorcycle taxis, which offer a convenient and economical alternative to auto-rickshaws for short-distance travel. This preference for RAPIDO suggests potential competition for auto-rickshaw operators. However, 18 individuals in the survey do not use smartphones, relying instead on traditional methods such as hailing auto-rickshaws directly.
Table 5: The introduction of ride-hailing apps affected the number of trips you complete in a day
| Has the introduction of ride-hailing apps affected the number of trips you complete in a day | ||
|---|---|---|
| Decreased | 10 drivers | |
| Stayed the same | 30 drivers | |
| Increased | 60 drivers | |
Graph 5: The introduction of ride-hailing apps affected the number of trips you complete in a day
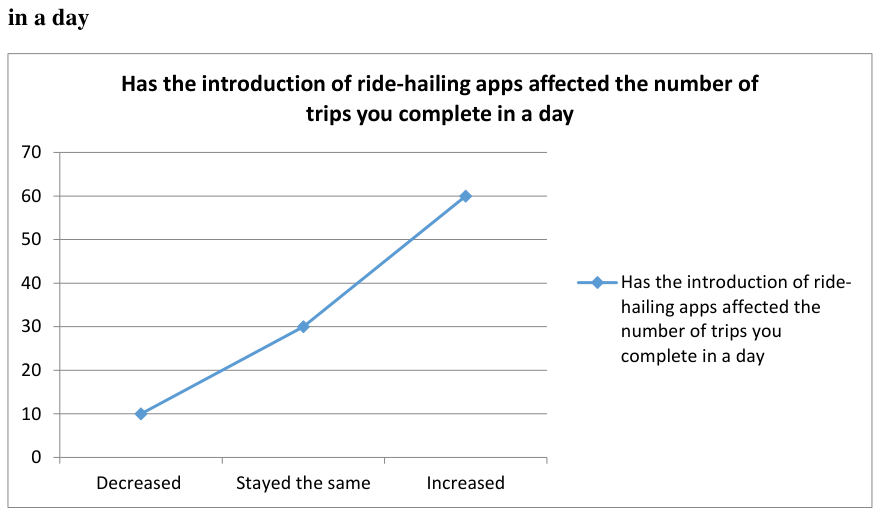
• Positive Impact on Trips:
The fact that 60% of drivers have seen an increase in the number of trips suggests that ride-hailing apps have generally had a positive impact on driver productivity. This increase could be attributed to greater accessibility and convenience for passengers, resulting in more frequent use of the service.
• Stable Trips:
About 30% of drivers reported that their daily trip count stayed the same. This indicates that while there may not have been an increase, the introduction of ride-hailing apps hasn't negatively impacted their trip numbers either. These drivers likely maintained a steady clientele or service demand.
• Negative Impact:
Approximately 10% of drivers experienced a decrease in the number of trips completed per day. This could be due to various factors such as increased competition among drivers, changes in customer behaviour, or local market dynamics that affect demand.
Table 6 : The impact of technology (apps, GPS, etc.)
| The impact of technology (apps, GPS, etc.) | |
|---|---|
| Positive impact | 70 Drivers |
| No impact | 20 Drivers |
| Negative impact | 10 Drivers |
Graph 6: Graph on The impact of technology (apps, GPS, etc.)
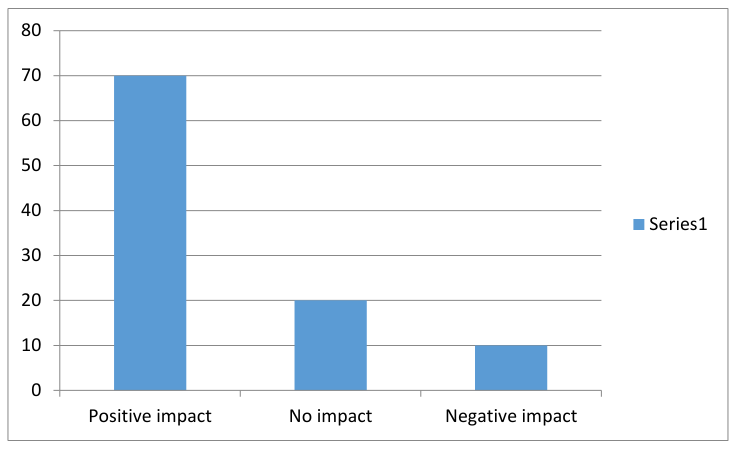
The analysis shows that a significant portion of auto rickshaw drivers, 70%, have a positive outlook on technology, especially appreciating the benefits of apps and GPS. These tools are seen as valuable for improving navigation, offering real-time traffic updates, and enhancing safety, making the driving experience smoother and more efficient. For many drivers, technology serves as a helpful assistant that supports their daily work, potentially reducing the stress of navigating unfamiliar routes or dealing with traffic congestion.
On the other hand, 20% of the drivers do not notice any significant impact from using technology, suggesting that they either do not rely on these tools or feel that their driving experience remains unchanged. A smaller group of 10% has a negative view, citing drawbacks such as distractions caused by apps or GPS, which can divert attention from the road. These drivers also express concerns about becoming overly dependent on technology, which might impair their decision-making or cause frustration when technical issues arise. This diverse range of opinions highlights that while technology offers clear advantages for many, it also presents challenges for some drivers.
Table 7: Impact of technology on the local economy in Mysore
| Impact of technology on the local economy in Mysore | |
|---|---|
| Positive | 50 drivers |
| Negative | 10 drivers |
| No significant impact | 40 drivers |
Graph 7: Impact of technology on the local economy in Mysore
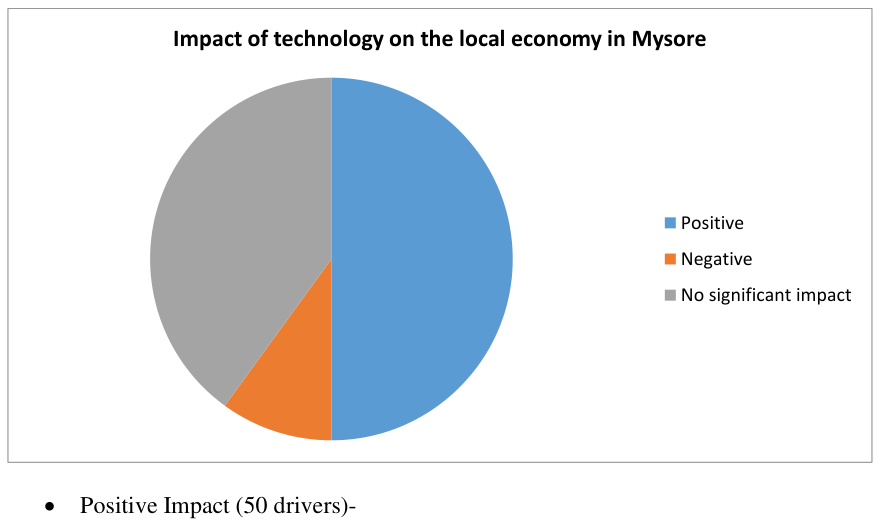
• Positive Impact (50 drivers)-
The 50 drivers who perceive a positive impact of technology on the local economy
• Negative Impact (10 drivers)-
The 10 drivers who see a negative impact highlight concerns
• No Significant Impact (40 drivers)
The 40 drivers who perceive no significant impact indicate that they haven't observed substantial changes, positive or negative, due to technology in the local economy.
• Balanced View:
While a majority (50 drivers) see a positive impact, there is also a notable minority (10 drivers) concerned about negative consequences.
• Moderate Impact:
A significant portion (40 drivers) perceives no substantial impact, suggesting that the effects of technology on the local economy may not be universally felt or recognized
Table 8: The increased in the use of technology affect on physical or mental health
| The increased in the use of technology affect on physical or mental health | |
|---|---|
| Yes | 25 Drivers |
| No | 50 Drivers |
| Not Sure | 25 Drivers |
Graph 8: The increased in the use of technology affect on physical or mental health
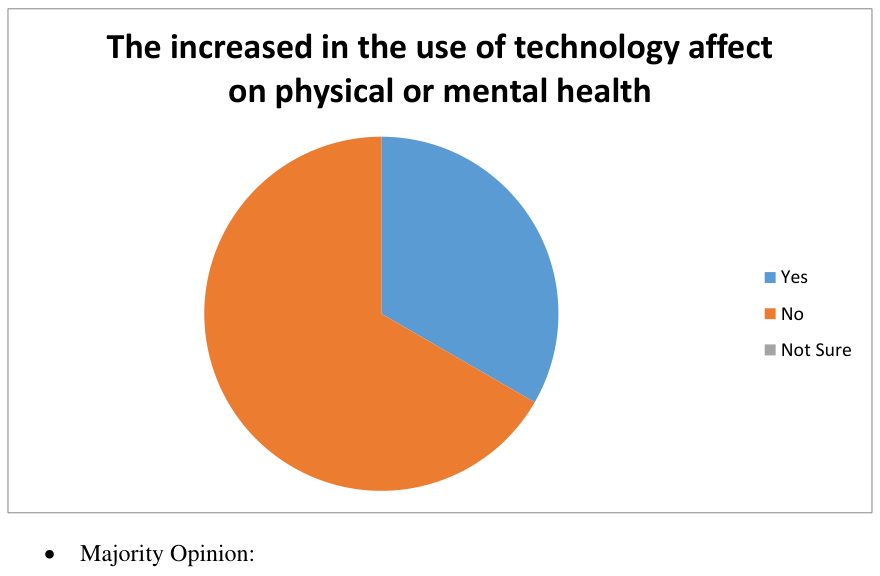
• Majority Opinion:
The largest group (50%) of drivers believe that increased use of technology does not affect physical or mental health. This suggests a significant portion of the surveyed population is not concerned about negative health impacts from technology.
• Concerned Minority:
25% of drivers are concerned that increased technology use does affect health. While this is a minority compared to those who are not concerned, it still represents a notable segment of the population.
• Uncertainty:
Another 25% of drivers are unsure about the impact. This uncertainty could stem from lack of information, conflicting opinions, or a need for more research and understanding on the topic.
Table 9: The use of technology affected the social status or perception of auto rickshaw drivers in society
| Has the use of technology affected the social status or perception of auto rickshaw drivers in society | |
|---|---|
| Yes | 20 drivers |
| No | 50 drivers |
| Not sure | 30 drivers |
Graph 9: The use of technology affected the social status or perception of auto rickshaw drivers in society.
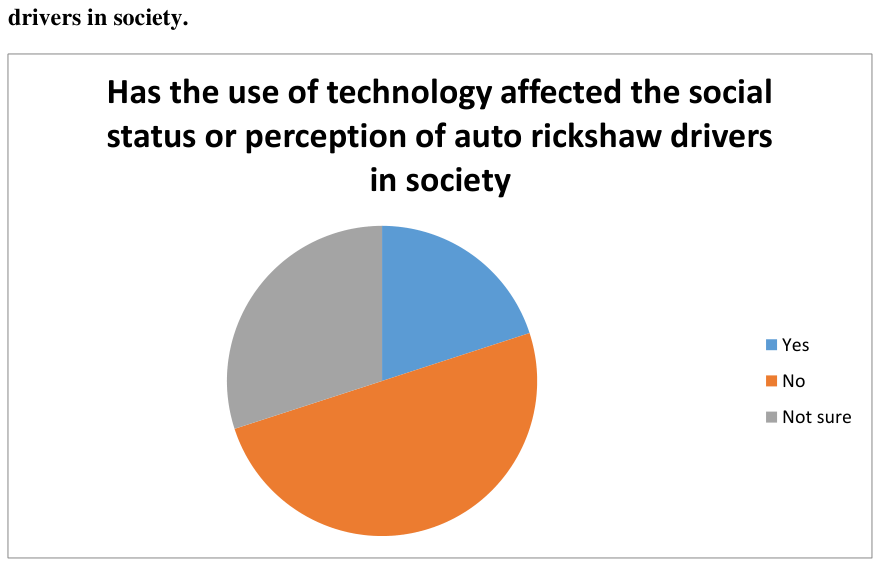
The responses regarding the impact of technology on the social status or perception of auto rickshaw drivers reveal a varied perspective within the driver community. A small group of 20 drivers feels that the use of technology, such as ride-hailing apps and GPS, has positively influenced how society views them, potentially modernizing the profession and making it more professional and tech-savvy. These drivers might believe that technology has elevated their status by offering a more structured and accessible service to customers. In contrast, 50 drivers do not perceive any change in their social status due to technology. They likely feel that despite adopting modern tools, the public continues to view auto rickshaw drivers through traditional lenses, with little change in societal perceptions. Additionally, 30 drivers are unsure, indicating ambiguity or indifference about the connection between technology and their social standing. For them, either the changes are too subtle to notice, or they do not prioritize societal perception as a key factor in their work. These varying responses highlight the complex relationship between technological advancements and the social status of auto rickshaw drivers.
Table 10: The introduction of ride-hailing apps affected the number of trips you complete in a day
| Has the introduction of ride-hailing apps affected the number of trips you complete in a day | ||
|---|---|---|
| Decreased | 10 drivers | |
| Stayed the same | 30 drivers | |
| Increased | 60 drivers | |
Graph 10: The introduction of ride-hailing apps affected the number of trips you complete in a day
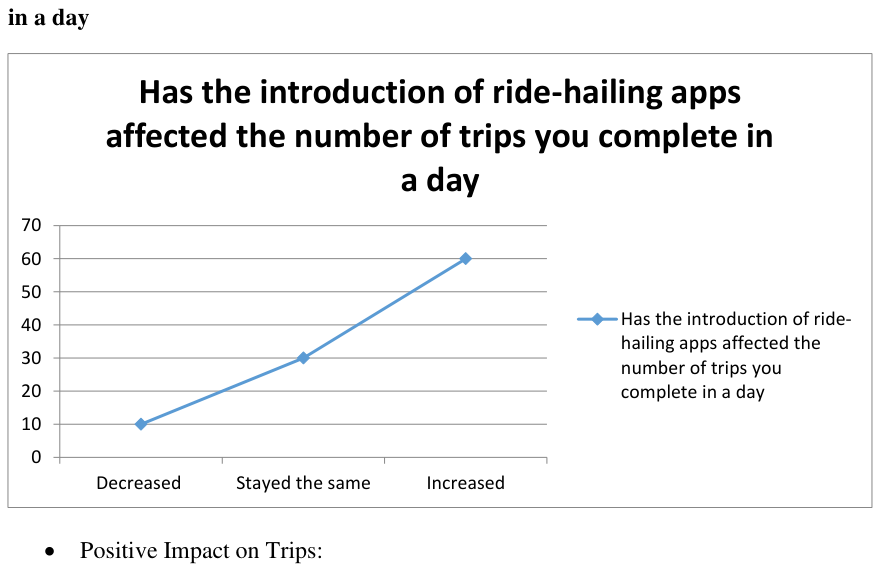
• Positive Impact on Trips:
The fact that 60% of drivers have seen an increase in the number of trips suggests that ride-hailing apps have generally had a positive impact on driver productivity. This increase could be attributed to greater accessibility and convenience for passengers, resulting in more frequent use of the service.
• Stable Trips:
About 30% of drivers reported that their daily trip count stayed the same. This indicates that while there may not have been an increase, the introduction of ride-hailing apps hasn't negatively impacted their trip numbers either.
• Negative Impact:
Approximately 10% of drivers experienced a decrease in the number of trips completed per day. This could be due to various factors such as increased competition among drivers, changes in customer behavior, or local market dynamics that affect demand.
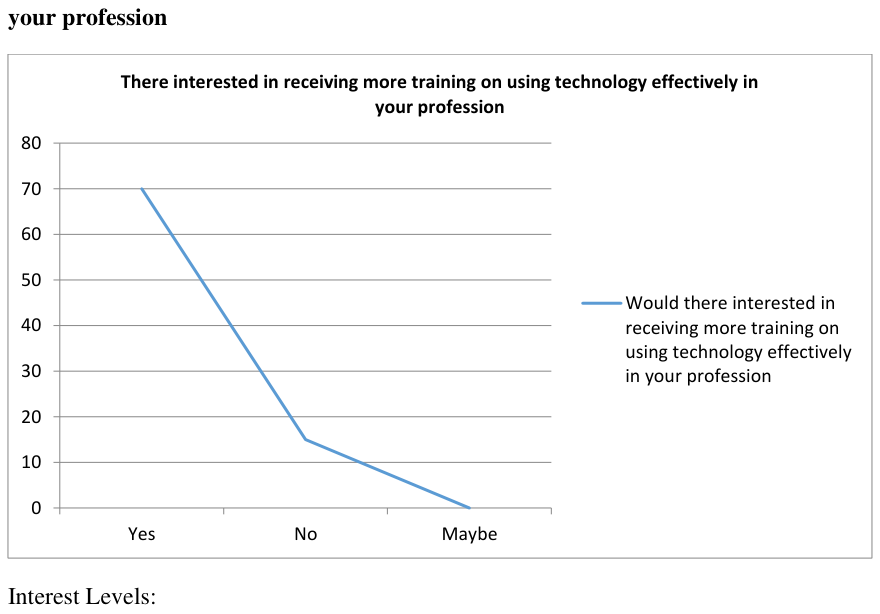
Table 11: There interested in receiving more training on using technology effectively in your profession
| There interested in receiving more training on using technology effectively in your profession | |
|---|---|
| Yes | 70 drivers |
| No | 15 drivers |
| Maybe | 15 drivers |
Graph 11: There interested in receiving more training on using technology effectively in your profession
Interest Levels:
• Yes (70 drivers):
This group shows a strong interest in receiving more training on using technology. They are likely to be motivated to improve their technological skills in their profession.
• No (15 drivers):
This group indicates a lack of interest in receiving more training on using technology. They may feel confident in their current technological skills or may not see the value in additional training.
• Maybe (15 drivers):
This group is uncertain about whether they want more training on technology. They might be open to it depending on the specifics or benefits of the training offeredremain relevant and effective.
Table 12: Have there is any believe that technology has increased safety while driving
| Opinions | Have there is any believe that technology has increased safety while driving |
|---|---|
| Yes | 50 drivers |
| No | 25 drivers |
| Unsure | 25 drivers |
Graph 12: Have there is any believe that technology has increased safety while driving

Interpretation and Implications:
• Positive Perception:
The fact that 50% of the drivers surveyed believe technology has increased safety suggests a significant level of trust and optimism in technological advancements in driving safety.
• Doubt and Uncertainty:
The combined 50% who are either unsure (25%) or believe technology hasn't increased safety (25%) indicate a considerable portion of skepticism or lack of clarity among drivers.
• Further Investigation:
To better understand these opinions, further investigation into specific technologies (like ABS, lane departure warnings, autonomous driving features) and their perceived effectiveness could provide insights into why opinions vary.
Table 13: customer feedback now compared to before using technology
| Opinions | customer feedback now compared to before using technology |
|---|---|
| Yes | 55 drivers |
| No | 25 drivers |
| Unsure | 20 drivers |
Graph 13: customer feedback now compared to before using technology

• Positive Perception:
A majority (55%) of the surveyed drivers believe that technology has improved customer feedback processes. This indicates a positive impact of technology on the quality and effectiveness of customer feedback systems.
• Negative Perception:
A quarter (25%) of drivers do not perceive any improvement in customer feedback due to technology. This suggests either dissatisfaction with current technological implementations or a perception that technology has not delivered expected improvements.
• Uncertainty:
One-fifth (20%) of drivers are unsure about the impact of technology on customer feedback. This uncertainty may stem from a lack of clear understanding or experience with technological changes in feedback mechanisms.
Table 14 : Have there is any believe that technology has increased safety while driving
| Opinions | Have there is any believe that technology has increased safety while driving |
|---|---|
| Yes | 50 drivers |
| No | 25 drivers |
| Unsure | 25 drivers |
Graph 14 : Have there is any believe that technology has increased safety while driving
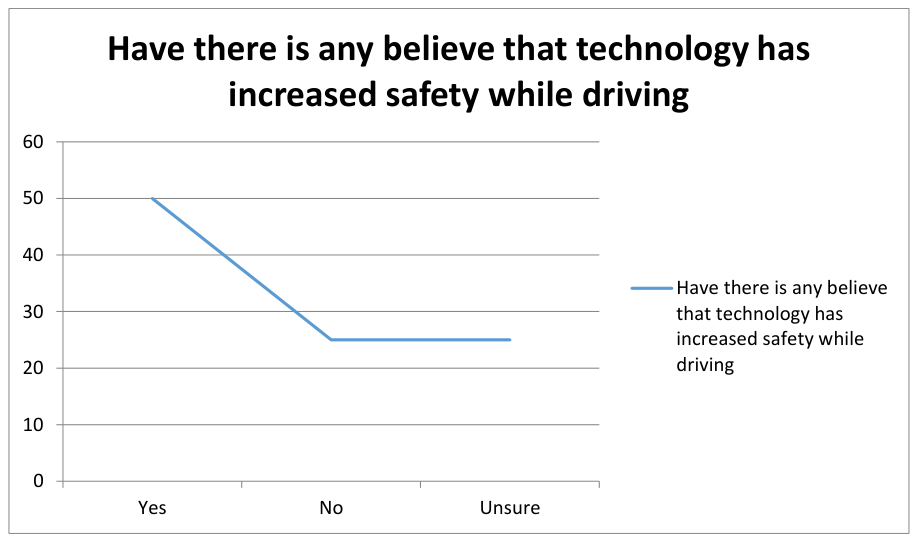
• Yes (50 drivers):
This indicates that 50 drivers believe that technology has increased safety while driving. This suggests a significant portion of the surveyed population perceives technology positively in terms of enhancing safety on the road.
• No (25 drivers):
25 drivers think that technology has not increased safety while driving. This viewpoint represents a smaller but still noteworthy proportion of the respondents who do not perceive technology as effective in enhancing safety.
• Unsure (25 drivers):
A substantial number of drivers (25) are unsure whether technology has increased safety while driving. This uncertainty highlights a significant portion of the surveyed population that lacks a clear opinion or may feel ambiguous about the impact of technology on driving safety.
Table 15: Future challenges do they foresee with the increasing use of technology in your profession
| Future challenges do they foresee with the increasing use of technology in your profession | |
|---|---|
| Job security | 25 drivers |
| Technological obsolescence | 35 drivers |
| Other | 40 drivers mentioned market saturation and dependency on technology companies. |
Graph 15: Future challenges do they foresee with the increasing use of technology in your profession

• Job Security:
With 25 mentions, it’s evident that professionals in this field are apprehensive about how technology might impact their job stability. This concern is common as automation and efficiency improvements can lead to workforce reductions or shifts in employment patterns.
• Technological Obsolescence:
The 35 mentions indicate a strong fear of being left behind as technology advances. This concern is crucial in professions where skills quickly become outdated, necessitating continuous learning and adaptation.
• Other Concerns (Market Saturation and Dependency):
The 40 mentions underline broader industry challenges beyond individual job roles, such as competitive pressures due to market saturation and the risks associated with heavy reliance on specific technology providers.
Table 16: Have there is any believe that technology has increased safety while driving
Table 17:- customer feedback now compared to before using technology
| Opinions | 4.27:- Have there is any believe that technology has increased safety while driving | 4.28:- customer feedback now compared to before using technology |
|---|---|---|
| Yes | 50 drivers | 55 drivers |
| No | 25 drivers | 25 drivers |
| Unsure | 25 drivers | 20 drivers |
Graph 16 and 17: Have there is any believe that technology has increased safety while driving and customer feedback now compared to before using technology

The impact of technology on safety while driving and customer feedback is viewed differently by auto rickshaw drivers. Regarding safety, 50 drivers believe that technology has enhanced their safety while driving, likely attributing this improvement to features such as real-time traffic updates, GPS navigation, and emergency alerts that help drivers avoid accidents and navigate more efficiently. However, 25 drivers feel that technology has not contributed to increased safety, suggesting they either do not rely on these tools or do not perceive them as adding any significant benefit to their driving experience. Additionally, 25 drivers are unsure, possibly indicating that they have not fully experienced or recognized the effects of technology on their safety. As for customer feedback, 55 drivers report that customer feedback has improved since they began using technology, possibly due to the transparency and convenience of platforms like ride-hailing apps, which allow for easier communication and rating systems. On the other hand, 25 drivers do not see an improvement in feedback, perhaps due to frustrations with the technology or limited interaction with customers outside of the app interface. Another 20 drivers are unsure about the impact on customer feedback, which may reflect mixed or inconclusive experiences with technology in terms of how feedback is received and handled.
Table 18: Has the interaction with passengers changed with the use of technology and Table 19: Handling of customer feedback or ratings from ride-hailing apps
| Table 4.29:- Has the interaction with passengers changed with the use of technology | Table 4.30:- Handling of customer feedback or ratings from ride-hailing apps | ||
|---|---|---|---|
| More pleasant | 40 drivers | - Improve my service | 60 drivers |
| Less pleasant | 10 drivers | Ignore it | 5 drivers |
| No change | 50 drivers | Other | 35 drivers mentioned responding politely and trying to resolve issues. |
Graph 18 and 19 : Has the interaction with passengers changed with the use of technology and Handling of customer feedback or ratings from ride-hailing apps

The use of technology in auto rickshaw driving has had varying effects on driver-passenger interactions.38 Forty drivers report that technology has made their interactions with passengers more pleasant, likely due to the streamlined nature of ride-hailing apps that enable smoother communication and a more professional experience. In contrast, 10 drivers find interactions less pleasant, possibly due to frustrations with the technology or the impersonal nature of app-based communication. Meanwhile, 50 drivers say there has been no change in their interactions, suggesting that technology hasn't notably affected their relationship with passengers. Regarding customer feedback, 60 drivers actively use feedback to improve their service, indicating a commitment to enhancing their performance based on passenger reviews. However, 5 drivers tend to ignore feedback, perhaps feeling it is irrelevant or unhelpful, while 35 drivers adopt a strategy of responding politely to feedback and attempting to resolve any issues, which reflects a customer-oriented approach to maintaining a positive reputation and improving their service.
Table 20:- Would Auto Drivers interested in receiving more training on using technology effectively in their profession
Table 21:- Do Auto Rikshaw Drivers think technology in auto rickshaws has contributed to environmental conservation efforts
Table 22:- Have other auto rickshaw drivers influenced decision to use ride-hailing apps
Table 23:- Are Auto Drivers concerned about how their personal data is used by ride-hailing apps
Table 24:- Have ride-hailing apps encouraged Auto drivers to explore other sources of income.
| Options Provided | Table 4.31:- Would Auto Drivers interested in receiving more training on using technology effectively in their profession | Table 4.32:- Do Auto Rickshaw Drivers think technology in auto rickshaws has contributed to environmental conservation efforts | Table 4.33:- Have other auto rickshaw drivers influenced decision to use ride-hailing apps | Table 4.34:- Are Auto Drivers concerned about how their personal data is used by ride-hailing apps | Table 4.34:- Have ride-hailing apps encouraged Auto drivers to explore other sources of income |
|---|---|---|---|---|---|
| Yes | 70 drivers | 50 drivers | 60 drivers | 45 drivers | 30 drivers |
| No | 15 drivers | 20 drivers | 20 drivers | 35 drivers | 50 drivers |
| Maybe | 15 drivers | 30 drivers | 20 drivers | 20 drivers | 20 drivers |
Graph 20:- Would Auto Drivers interested in receiving more training on using technology effectively in their profession
Graph 21:- Do Auto Rikshaw Drivers think technology in auto rickshaws has contributed to environmental conservation efforts
Graph 22:- Have other auto rickshaw drivers influenced decision to use ride-hailing apps
Graph 23:- Are Auto Drivers concerned about how their personal data is used by ride-hailing apps
Graph 24:- Have ride-hailing apps encouraged Auto drivers to explore other sources of income.

Interest in receiving more training on using technology effectively:
• A significant majority (70 out of 100 drivers) are interested in receiving more training on using technology effectively. This indicates a high level of interest among auto rickshaw drivers to enhance their technological skills, which could potentially improve their profession.
• Opinion on whether technology in auto rickshaws has contributed to environmental conservation efforts:
Analysis: A moderate majority (50 out of 100 drivers) believe that technology in auto rickshaws has contributed to environmental conservation efforts. However, there is a significant proportion (30 drivers) who are uncertain (maybe), suggesting a need for more clarity or education on this topic.
• Influence of other auto rickshaw drivers on the decision to use ride-hailing apps: Analysis:
A strong majority (60 out of 100 drivers) have been influenced by other auto rickshaw drivers to use ride-hailing apps. This indicates a significant influence of peer behavior in adopting technology-based solutions within the profession.
• Concern about how personal data is used by ride-hailing apps:
Analysis: A notable majority (45 out of 100 drivers) express concern about how their personal data is used by ride-hailing apps. This reflects a cautious attitude towards privacy issues among auto rickshaw drivers using these apps.
• Encouragement from ride-hailing apps to explore other sources of income:
A minority (30 out of 100 drivers) have been encouraged by ride-hailing apps to explore other sources of income.
Table 25:- The maintenance cost of auto rickshaw Drivers changed with the use of technology
| The maintenance cost of auto rickshaw Drivers changed with the use of technology | |
|---|---|
| Increased | 20 drivers |
| Decreased | 10 drivers |
| No change | 70 drivers |
Graph 25:- The maintenance cost of auto rickshaw Drivers changed with the use of technology

• Positive Impact:
A smaller group experienced decreased maintenance costs, indicating that there is potential for technology to optimize operations and reduce expenditures.
• Neutral Impact:
The largest group experienced no change, implying that while technology adoption may have other benefits, it hasn't directly affected maintenance costs.
• Negative Impact:
A notable portion experienced increased maintenance costs, possibly due to initial investment in technology, higher maintenance requirements for new tech, or other factors.
Table 26:- Do Auto Rikshaw Drivers believe using technology has helped to improve any specific skills related to their profession
| Do Auto Rikshaw Drivers believe using technology has helped to improve any specific skills related to their profession | |
|---|---|
| Yes | 45 drivers |
| No | 30 drivers |
| Not Sure | 25 drivers |
Graph 26:- Do Auto Rikshaw Drivers believe using technology has helped to improve any specific skills related to their profession

Forty-five drivers believe that using technology has helped improve specific skills related to their profession, indicating that they recognize the positive impact of technological tools on their abilities, such as navigation, time management, and customer service. On the other hand, 30 drivers feel that technology has not contributed to improving any particular skills, possibly due to limited engagement with or understanding of the tools available to them. Additionally, 25 drivers are unsure whether technology has had any effect on skill development, suggesting that they may not have observed significant changes in their work performance or may not be fully aware of the potential benefits technology offers in enhancing their professional skills.
Table 27:- Satisfaction of Auto Rikshaw Drivers with their job as an auto rickshaw driver since using technology
| Satisfaction of Auto Rikshaw Drivers with their job as an auto rickshaw driver since using technology | |
|---|---|
| Very satisfied | 50 |
| Somewhat satisfied | 30 |
| Not satisfied | 20 |
Graph 27:- Satisfaction of Auto Rikshaw Drivers with their job as an auto rickshaw driver since using technology

Fifty respondents report being highly satisfied with their job as auto rickshaw drivers since using technology, highlighting the positive impact of technological tools on their overall work experience. These drivers likely appreciate the convenience, efficiency, and safety features that technology, such as apps and GPS, brings to their daily tasks, enhancing their job satisfaction and sense of professionalism.
In contrast, thirty respondents express moderate satisfaction, suggesting that while technology has improved their work to some degree, it might not have fully met all of their expectations or needs. There is a subset of 20 drivers, however, who report dissatisfaction with their job, indicating that technology may not have made a significant positive change in their work experience. These drivers may face challenges like technological malfunctions, difficulty adapting to new systems, or a lack of clear benefits, which could affect their overall satisfaction.
Table 28:- Do Auto Rikshaw Drivers satisfied in using online transactions like G Pays and Phone Pay:
| Do Auto Rikshaw Drivers satisfied in using online transactions like G Pays and Phone Pays | |
|---|---|
| Very Satisfied | 70 |
| Satisfied | 20 |
| Not Comfortable | 10 |
Graph 28:- Do Auto Rikshaw Drivers satisfied in using online transactions like G Pays and Phone Pay :

A significant majority of drivers, 70%, report being very satisfied with using digital platforms, indicating strong approval and confidence in these methods. Additionally, 20% of drivers express satisfaction with these platforms, suggesting that they find them beneficial, though perhaps not as impactful as those who are very satisfied. This brings the overall satisfaction rate to 90%, showcasing widespread acceptance and appreciation for digital payment methods among drivers.
However, 10% of drivers are not comfortable with using digital platforms, which indicates that a small minority may face challenges in adopting these technologies. While most drivers find digital platforms convenient and efficient, this group might require additional support or training to fully integrate these methods into their daily operations. The need for further assistance highlights an area where improvements could be made to increase full adoption and enhance the experience for all drivers.
Findings
The demographic analysis of Mysore’s auto rickshaw drivers reveals that the majority fall within the 30-45 age group, with 45 individuals, of whom 38 are male and 7 are female. This shows a clear gender disparity, particularly in this age range. When it comes to smart phone usage, a significant 82 out of 100 drivers have smart phones, indicating the widespread adoption of technology in the sector. Drivers’ use of ride-hailing apps like OLA, UBER, and RAPIDO has had a notable impact, increasing their daily trips while also improving their perceptions of safety, health, and social status. In addition, the technological influence extends to the local economy, as drivers acknowledge the positive effects of customer feedback and environmental conservation. There is also a high interest among drivers for technology training, with a particular emphasis on enhancing safety measures. However, some concerns remain, especially around the use of personal data and the rising maintenance costs tied to tech integration. Despite these challenges, job satisfaction is high, with 70% of drivers expressing strong satisfaction with digital payment systems like G Pay and PhonePe, and 90% reporting overall contentment with their work, reflecting the positive shift technology has brought to their daily operations.
Suggestions
The segmented analysis of age and gender explores why males consistently outnumber females in all age groups and investigates if this disparity affects technology adoption, earnings, or perceptions. It also focuses on how different age groups, particularly the 30-45 age group, perceive and utilize technology compared to younger or older drivers. In examining the impact of smartphone and app usage on earnings, the frequency of smartphone use is correlated with earnings data to determine if more frequent use leads to higher earnings through app usage. Additionally, driver preferences for specific app functionalities are analyzed to assess if they are linked to increased earnings or job satisfaction. The perception of technology's economic impact is further explored, especially in relation to the local economy, to identify any perceived economic benefits or drawbacks. The relationship between technology, social status, and job satisfaction is also studied to understand how technology affects drivers’ status and overall satisfaction. The analysis also covers safety, customer feedback, and environmental impact, including exploring how perceived safety improvements and customer feedback mechanisms may influence driver earnings. Environmental considerations are examined to determine if drivers see a connection between environmental efforts and economic benefits. The interest in training and support needs is analyzed to propose targeted programs that could improve technological proficiency and enhance earnings. Government policy and support for technology adoption is explored to identify gaps that may hinder adoption and earnings potential. Digital payments' acceptance and its impact on earnings is also studied, with a focus on satisfaction with online transactions and addressing concerns about personal data to increase adoption rates. Maintenance costs and skill enhancement are analyzed to understand how technological advancements have impacted costs and if perceived skill improvements translate to higher earnings. The competitive landscape and future challenges are explored to assess how increased competition due to technology may affect earnings and to address anticipated challenges to mitigate potential negative impacts.
Conclusion
Based on a comprehensive analysis of data from 100 respondents regarding the impact of technology on auto rickshaw drivers in Mysore, several key conclusions can be drawn. The majority of drivers surveyed are in the 30-45 age group, indicating a middle-aged demographic dominance in the profession, with a noticeable gender disparity where males outnumber females across all age groups, particularly in the 30-45 range. This gender imbalance may reflect challenges or preferences in technology adoption and earnings. Smartphone penetration is high, with 82% of drivers using smartphones, showing strong technological readiness. The use of ride-hailing apps, such as Rapido, is significant and affects the number of trips completed and earnings. Drivers generally view technology, including apps and GPS, positively, appreciating its role in enhancing the driving experience, safety, and customer feedback. Positive perceptions of technology correlate with increased satisfaction with specific ride-hailing apps. Economically, drivers believe technology has a positive impact on the local economy, improving service efficiency and customer satisfaction, while also boosting their social status. However, challenges such as increased competition, maintenance costs, and concerns about privacy and data usage are also noted. Many drivers express interest in more training to improve their technological skills, suggesting potential for higher earnings. While there is some variation in satisfaction with government support for technology adoption, it is clear that there is room for improvement in policies. Digital payments like G Pay and Phone Pay are well-received, though some concerns about usage persist. Additionally, drivers recognize the role of technology in environmental conservation and acknowledge safety improvements, which could influence their driving behavior and earnings.
*****
Footnotes
3. Steve Bucher, ‘The Evolution of GPS - USC Viterbi School of Engineering’ (3 May 2005) <https://illumin.usc.edu/the-evolution-of-gps/> accessed 4 February 2025.
4. ‘Ola News: Ola Latest News & Recent Ola Latest Updates | The Economic Times’ <https://economictimes.indiatimes.com/tech/ola> accessed 4 February 2025.
5. ‘Earn Money by Driving or Get a Ride Now | Uber India’ <https://www.uber.com/in/en/> accessed 4 February 2025.
6. ‘Rapido - Bike Taxi, Auto & Cab App’ <https://www.rapido.bike/> accessed 4 February 2025.
7. ‘Ride or Drive with Lyft’ <https://www.lyft.com/> accessed 4 February 2025.
8. ‘How Grab Beat Uber as Best Ride-Hailing App in Southeast Asia’ (Yellosoft) <https://www.yelowsoft.com/blog/grab-defeat-uber-becomes-biggest-ride-hailing-company-in-southeast-asia/> accessed 4 February 2025.
9. ‘Best China Taxi Apps: DiDi, Uber in China&Meituan Dache | Trip.Com’ <https://www.trip.com/guide/phone/china-taxi-app.html> accessed 4 February 2025.
10. Careem, ‘The Everything App | Careem’ <https://www.careem.com/> accessed 4 February 2025.
11. ‘Gojek Super App’ <https://www.gojek.com/en-id> accessed 4 February 2025.
12. ‘Pathao - #1 Platform in Bangladesh - Ridesharing and More!’ <https://pathao.com/> accessed 4 February 2025.
13. MA Majid, Charles Rajesh Kumar J and Arbaz Ahmed, ‘Advances in Electric Vehicles for a Self-Reliant Energy Ecosystem and Powering a Sustainable Future in India’ (2024) 10 e-Prime - Advances in Electrical Engineering, Electronics and Energy 100753.
14. Massimo Bovenzi, ‘A Longitudinal Study of Low Back Pain and Daily Vibration Exposure in Professional Drivers’ (2010) 48 Industrial Health 584.
15. A Mani, Madhav Pai and R Aggarwal, ‘Sustainable Urban Transport in India: Role of the Auto-Rickshaw Sector’ (2012) <https://www.semanticscholar.org/paper/Sustainable-Urban-Transport-in-India%3A-Role-of-the-Mani-Pai/c8633e5745758d3595c78c15e1e2442a0bcc2d58> accessed 4 February 2025.
16. Paul Starkey and others, ‘Motorcycle Three-Wheelers in Pakistan: Low-Cost Rural Transport Services, Crucial for Women’s Mobility’ (2021) 12 Transportation Research Interdisciplinary Perspectives 100479.
17. ‘A Study on Auto-Rickshaw Users and Drivers Characteristics in Patna’ (ResearchGate) <https://www.researchgate.net/publication/352708053_A_Study_on_Auto-Rickshaw_Users_and_Drivers_Characteristics_in_Patna> accessed 4 February 2025.
18. ‘Clean and Sustainable Transportation through Electric Vehicles — a User Survey of Three-Wheeler Vehicles in Pakistan’ (ResearchGate) <https://www.researchgate.net/publication/358546403_Clean_and_sustainable_trans portation_through_electric_vehicles_-_a_user_survey_of_three-wheeler_vehicles_in_Pakistan> accessed 4 February 2025.
19. Chaya Bagrecha and others, ‘Financial Well Being of Auto Drivers in Bangalore A Study Conducted under Research Promotion Scheme of AICTE’ <https://www.academia.edu/19182222/Financial_Well_being_of_Aut o_Drivers_in_Bangalore_A_Study_Conducted_under_Research_Promotion_Scheme_of_AICTE> accessed 4 February 2025.
20. ‘Analysis of Sustentation of Auto Rickshaw Driver during Covid-19 Lock Down’ (ResearchGate) <https://www.researchgate.net/publication/346174309_Analysis_of_Sustentation_of_Auto_Rickshaw_Driver_during_Covid-19_Lock_Down> accessed 4 February 2025.
21. Geetam Tiwari, Deepty Jain and Kalaga Rao, ‘Impact of Public Transport and Non-Motorized Transport Infrastructure on Travel Mode Shares, Energy, Emissions and Safety: Case of Indian Cities’ [2015] World Transit Research <https://www.worldtransitresearch.info/research/5867>.
22. ‘Promoting Financial Inclusion Through Digital Wallets: An Empirical Study with Street Vendors’ (ResearchGate) <https://www.researchgate.net/publication/355082881_Promoting_Financial_Inclusion_Through_Digital_Wallets_An_Empirical_Study_with_Street_Vendors> accessed 4 February 2025.
23. Sayoojkumar.K.P, ‘SOCIO-ECONOMIC AND HEALTH STATUS OF AUTO –RICKSHAW DRIVERS OF CALICUT CITY’, JETIR (2017) <https://www.jetir.org/view?paper=JETIR1711158> accessed 4 February 2025.
24. M Yesurajan and Dr T Indra, ‘Common Work Related Health Problems of Auto Rickshaw Drivers in India - Causes and Strategies’ (2017) 3 International Journal of Applied Research 232.
25. Rina Kashyap and Anjali Bhatia, ‘Taxi Drivers and Taxidars: A Case Study of Uber and Ola in Delhi’ (2018) 34 Journal of Developing Societies 169.
26. Veena Melwani and others, ‘Study to Assess the Socio-Demographic Profile, Health Status and Working Conditions of Auto-Rickshaw Drivers in Bhopal’ (2018) 5 International Journal Of Community Medicine And Public Health 1323.
27. Jithu T V, ‘Empowerment through Employment: A Study among the Women Auto-Rickshaw Drivers’ International Journal of Science and Research (IJSR) <https://www.ijsr.net/> accessed 4 February 2025.
28. ‘Taxi Drivers and Taxidars: A Case Study of Uber and Ola in Delhi’ (ResearchGate) <https://www.researchgate.net/publication/323776651_Taxi_Drivers_and_Taxidars_A_Case_Study_of_Uber_and_Ola_in_Delhi> accessed 4 February 2025.
29. ‘Pricing Strategy of Cab Aggregators in India’ (ResearchGate) <https://www.researchgate.net/p ublication/332592833_Pricing_strategy_of_cab_aggregators_in_India> accessed 4 February 2025.
30. Vikram K Joshi, ‘EMPIRICAL STUDY OF TECHNOLOGY BASED AUTO-RICKSHAW SERVICE QUALITY PERCEPTION USING SSTQUAL’ (2020) 11 INTERNATIONAL JOURNAL OF MANAGEMENT (IJM) 1.
31. Prakash S Chougule and others, ‘A STUDY THE PROBLEMS OF AUTO RICKSHAW DRIVERS IN KOLHAPUR CITY USING STATISTICAL TOOLS AND TECHNIQUES’ (2020) 6 EPRA International Journal of Multidisciplinary Research (IJMR) 1.
32. ‘Share Auto Rickshaw Transport Service’ (ResearchGate) <https://www.researchgate.net/publicatio n/350173243_Share_Auto_Rickshaw_Transport_Service> accessed 4 February 2025.
33. ‘A STUDY THE PROBLEMS OF AUTO RICKSHAW DRIVERS IN KOLHAPUR CITY USING STATISTICAL TOOLS AND TECHNIQUES’ (ResearchGate) <https://www.researchgate.net/publication/3 47050777_A_STUDY_THE_PROBLEMS_OF_AUTO_RICKSHAW_DRIVERS_IN_KOLHAPUR_CITY_USING_STATISTICAL_TOOLS_AND_TECHNIQUES> accessed 4 February 2025.
34. Sarannya Sivasankaran and Poornima S, ‘A STUDY ON JOB SATISFACTION OF AUTO DRIVERS WITH SPECIAL REFERNCE TO COIMBATORE DISTRICT’ (2022) 9 International Journal of Innovative Research in Technology 1451.
35. Noor Firdoos Jahan and others, ‘Auto Drivers’ Preferences towards Leading Ride Hailing Companies in Bangalore’ (2023) 13 European Economic Letters (EEL) 1498.
36. Abdullahi Mohamoud, ‘The Role of Auto Rickshaw Drivers on Income Performance among Society in Banadir Region-Mogadishu-Somalia’ (2023) 9 IJRDO - Journal of Applied Management Science 1.
37. Shiv Priye, M Manoj and Rajeev Ranjan, ‘Understanding the Socioeconomic Characteristics of Paratransit Drivers and Their Perceptions toward Electric Three-Wheeled Rickshaws in Delhi, India’ (2021) 45 IATSS Research 357.
38. ‘Understanding Driver-Passenger Interactions in Vehicular Crowdsensing’ (ResearchGate) <https://www.researchgate.net/publication/355399263_Understanding_Driver-Passenger_Interactions_in_Vehicular_Crowdsensing> accessed 4 February 2025.