
Introduction
Digital transformation has changed how goods are marketed and sold, particularly in developing economies where firms adopt digital technologies to reach wider customer bases (Laudon & Traver, 2021). The International Telecommunication Union (2023) estimates that about 5.4 billion people, roughly 67% of the world’s population, now use the internet, and this connectivity has accelerated the adoption of online shopping. In Sub-Saharan Africa, affordable mobile devices have driven rapid growth in mobile commerce, and in Tanzania mobile money services such as M-Pesa, Airtel Money and Tigo Pesa have lowered transaction barriers for buyers and sellers (Bank of Tanzania, 2022). Platforms such as WhatsApp, Instagram and Facebook now serve as informal storefronts in urban commercial centres.
In such settings the customer cannot touch the fabric, check the fit or compare colour under natural light. Product evaluation therefore depends on cues such as photographs, videos, written descriptions and the experiences of other buyers. Zeithaml (1988) defines perceived quality as the consumer’s judgement about a product’s overall excellence or superiority, a judgement that is subjective and may differ from objective quality. The Theory of Perceived Risk holds that consumer behaviour is guided by how attributes are perceived rather than by what they objectively are, and that purchases involve uncertainty about outcomes (Bauer, 1960; Cox, 1967). Featherman and Pavlou (2003) extended the theory to online transactions, noting that physical separation between buyer and seller and the inability to inspect products intensify performance risk, that is, the fear that a product will not perform as expected. Favourable quality perceptions are therefore expected to reduce this uncertainty and raise the likelihood of purchase.
Empirical studies support this expectation. Kim and Lennon (2008) found that both product images and written descriptions shape consumers’ attitudes towards apparel products, and that detailed descriptions influence purchase intentions, when physical inspection is impossible, and Pavlou and Fygenson (2006) showed that perceptions of the quality of product information influence online purchase completion. Peer-generated reviews and word of mouth also act as proxies for quality when buyers and sellers are unequally informed (Chevalier & Mayzlin, 2006; Park et al., 2007).
Kariakoo Market in Dar es Salaam is one of East Africa’s largest commercial hubs, and its clothing traders increasingly rely on social media to display products and process orders. The Mtu Outfit Association is a collective of such traders. This shift has occurred largely without standardised procedures for verifying product quality or ensuring accurate representation of items, and customers report discrepancies between posted images and items received. Little empirical evidence exists, however, on how perceived product quality influences purchase decisions within an informal, association-based trading environment. This study therefore assessed the influence of perceived product quality on customers’ purchase decisions in digital retail environments, testing the hypothesis that perceived product quality has a significant influence on purchase decisions.
Methods
A. Study design and setting
A quantitative, descriptive–explanatory case study design was adopted within a positivist research philosophy (Saunders et al., 2019; Yin, 2018). The descriptive component documented how customers perceive product quality, and the explanatory component examined the relationship between perceived product quality and purchase decision through correlation and regression analysis. The study was conducted among customers of the Mtu Outfit Association, a recognised body of clothing and fashion traders at Kariakoo Market, Ilala District, Dar es Salaam. The market combines traditional face-to-face trading with growing digital sales through WhatsApp, Instagram, Facebook and mobile money, and it therefore provides a bounded setting in which perceptions of quality are formed almost entirely from digital cues.
B. Study population and eligibility criteria
The study population comprised adult customers who had purchased clothing items from Mtu Outfit Association traders through social media or mobile commerce platforms during the preceding 12 months. Customers with no digital purchase experience with Association traders were not eligible, since they could not assess the quality of items bought online. The Association’s records and preliminary market observation identified approximately 1,200 regular digital customers.
C. Sample size determination and sampling
The sample size for the finite customer population was calculated using Yamane’s (1967) formula, n = N / (1 + N(e)²), where N is the population size and e the margin of error. With N = 1,200 and a 5% margin of error at the 95% confidence level, the formula yielded approximately 300 respondents. Because of logistical, temporal and resource constraints, a reduced sample of 100 customers was adopted. Respondents were selected by simple random sampling from a frame compiled from Association records and customer contact points within the market, so that each eligible customer had an equal and known chance of selection.
D. Data collection procedures
Data were collected with a structured, self-administered questionnaire developed in English and translated into Swahili, with back-translation used to verify equivalence. The instrument covered respondent demographics, digital retail engagement, perception constructs and purchase decision. Content validity was established through expert review by the research supervisor and, where feasible, one additional marketing specialist, and the questionnaire was pilot-tested with 20 customers of similar clothing traders outside the Association, who were excluded from the final sample.
All constructs were rated on a five-point Likert scale (1 = strongly disagree to 5 = strongly agree). Perceived product quality was measured with five items adapted from Kim and Lennon (2008): (PQ1) clothing items purchased from the traders are of good quality; (PQ2) images and descriptions shared by the traders accurately reflect the actual product; (PQ3) I am generally satisfied with the quality of items received after a digital purchase; (PQ4) there is usually little difference between the product advertised online and the product delivered; and (PQ5) the quality of products sold digitally meets my expectations. Purchase decision, the dependent variable, was measured with eight items adapted from Pavlou (2003) covering intention to continue purchasing, willingness to recommend, and the perceived influence of trust, quality and risk on purchasing. Perceived trust (Gefen et al., 2003) and perceived risk (Featherman & Pavlou, 2003) were measured with five items each and were included in the regression model as control variables.
E. Data analysis
Data were cleaned, coded and analysed using IBM SPSS Statistics version 26. Internal consistency was assessed with Cronbach’s alpha, with α ≥ 0.70 considered acceptable (Nunnally, 1978). Respondent characteristics and item responses were summarised using frequencies, percentages, means and standard deviations. Means were interpreted as low (1.00–2.49), moderate (2.50–3.49) or high (3.50–5.00). Pearson’s product–moment correlation was used to examine the bivariate relationship between perceived product quality and purchase decision. Multiple linear regression, with perceived product quality, perceived trust and perceived risk entered simultaneously, was then used to estimate the independent effect of perceived product quality on purchase decision. Multicollinearity was checked with the variance inflation factor (VIF), and normality and homoscedasticity of residuals were inspected graphically. The hypothesis that perceived product quality has a significant influence on purchase decision was tested at the 5% significance level (p < 0.05).
F. Ethical considerations
Ethical clearance was sought from the Dar es Salaam Tumaini University (DarTU) Research Ethics Committee before data collection. All participants gave informed consent after being told that participation was voluntary, that they could withdraw at any time without penalty, and that their responses would be kept confidential. Alphanumeric codes were used instead of names, completed questionnaires were stored securely with access restricted to the research team, and results are reported only in aggregate form. Questionnaires were administered at times convenient to respondents so as to minimise disruption to their commercial activities.
Results
Of the 100 questionnaires distributed to customers, 94 were returned (94.0%) and 90 were complete and valid, giving an effective response rate of 90.0%. Most respondents were female (62.2%) and aged 25–34 years (42.2%), and 68.9% held a certificate, diploma or university degree (Table 1). WhatsApp was the platform most used for purchasing from Association traders (86.7%), followed by mobile money services (73.3%) and Instagram (57.8%).
| Characteristic | Frequency (n) | Percentage (%) |
|---|---|---|
| Gender | ||
| Male | 34 | 37.8 |
| Female | 56 | 62.2 |
| Age group (years) | ||
| 18–24 | 22 | 24.4 |
| 25–34 | 38 | 42.2 |
| 35–44 | 20 | 22.2 |
| 45–54 | 8 | 8.9 |
| 55 and above | 2 | 2.2 |
| Level of education | ||
| Primary | 4 | 4.4 |
| Secondary | 24 | 26.7 |
| Certificate/Diploma | 30 | 33.3 |
| Bachelor’s degree | 26 | 28.9 |
| Master’s degree or above | 6 | 6.7 |
| Employment status | ||
| Formal employment | 26 | 28.9 |
| Self-employed/business owner | 28 | 31.1 |
| Informal trader | 12 | 13.3 |
| Student | 18 | 20.0 |
| Unemployed | 4 | 4.4 |
| Other | 2 | 2.2 |
Table 1: Demographic characteristics of respondents (N = 90)
Source: Field data (2026).
A. Reliability of the product quality scale
The five-item perceived product quality scale had a Cronbach’s alpha of 0.80, indicating good internal consistency. The purchase decision scale (eight items; α = 0.86), the perceived trust scale (α = 0.83) and the perceived risk scale (α = 0.77) also exceeded the 0.70 threshold, and the overall instrument had an alpha of 0.85.
B. Perceived product quality
Perceived product quality recorded a high overall mean (M = 3.69, SD = 0.66), the highest among the three perception constructs (perceived trust M = 3.52; perceived risk M = 3.51) and above that of purchase decision (M = 3.66). On average, 64.9% of respondents agreed or strongly agreed with the five quality statements (Table 2; Figure 1). Agreement was strongest for the general quality of the clothing items (PQ1, 73.3%) and for quality meeting expectations (PQ5, 71.1%), and 68.9% were satisfied with the quality of items received (PQ3). Agreement was lower for the two items that concern the link between online presentation and the delivered product: 57.8% agreed that images and descriptions accurately reflect the actual product (PQ2) and 53.3% agreed that there is little difference between the advertised and delivered product (PQ4). For PQ4, 22.2% disagreed or strongly disagreed and a further 24.4% were neutral.
| Item | Agree/Strongly agree, n | % | Mean |
|---|---|---|---|
| PQ1 Clothing items are of good quality | 66 | 73.3 | 3.85 |
| PQ2 Images and descriptions accurately reflect the product | 52 | 57.8 | 3.55 |
| PQ3 Generally satisfied with quality received | 62 | 68.9 | 3.78 |
| PQ4 Little difference between advertised and delivered product | 48 | 53.3 | 3.44 |
| PQ5 Quality meets my expectations | 64 | 71.1 | 3.81 |
| Perceived product quality (overall) | – | – | 3.69 (SD = 0.66) |
Table 2: Respondents’ perceptions of product quality (N = 90)
Source: Field data (2026). Scale: 1 = strongly disagree, 5 = strongly agree. Overall mean: 1.00–2.49 = low; 2.50–3.49 = moderate; 3.50–5.00 = high.
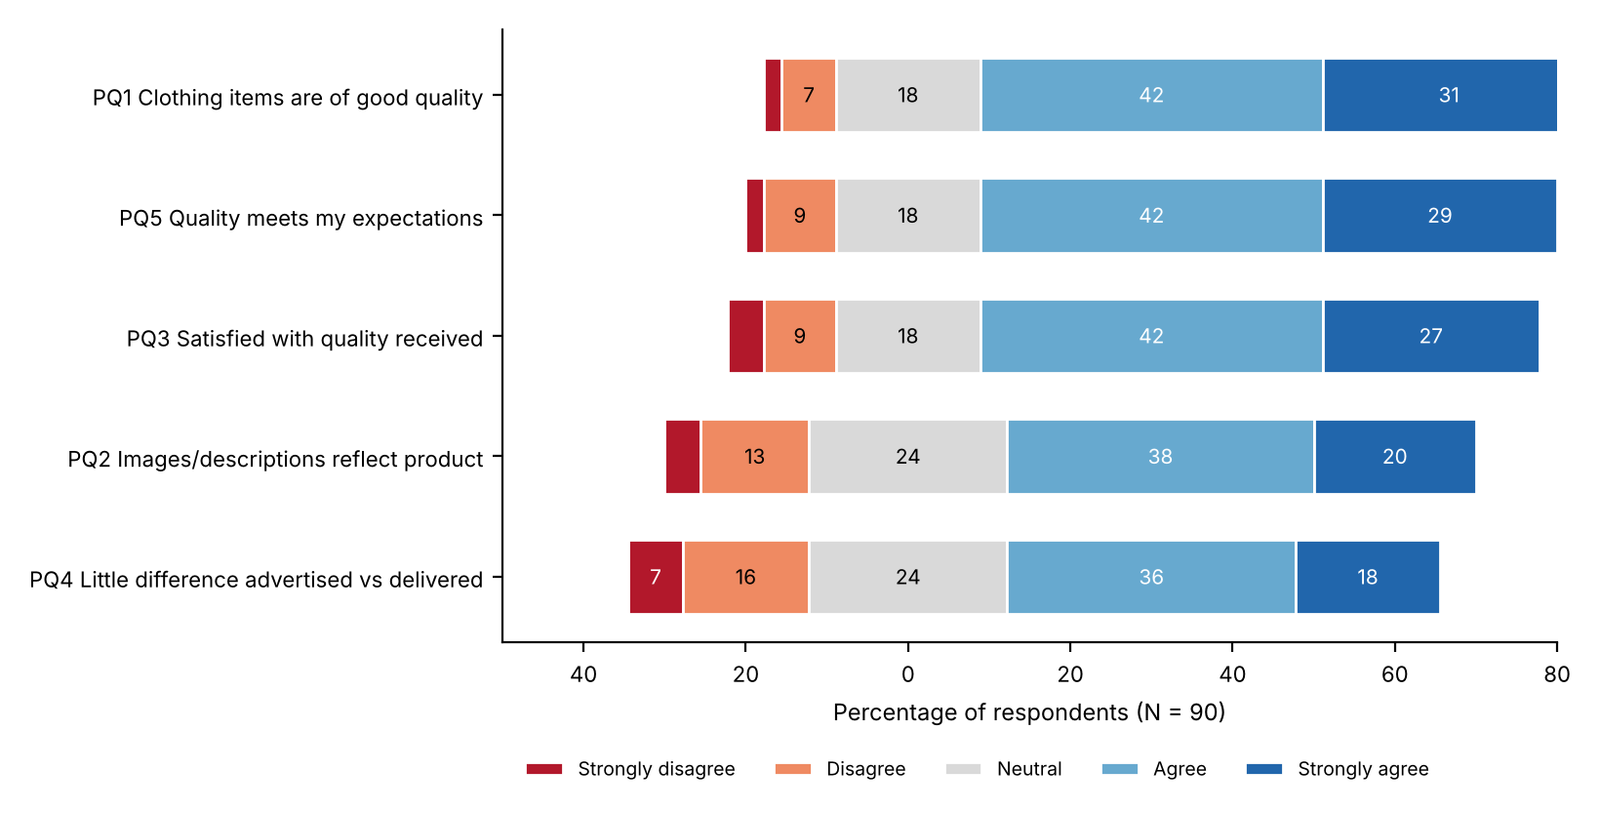
Figure 1: Distribution of responses to the perceived product quality items (N = 90)
Source: Field data (2026). Values are percentages; segments below 6% are not labelled.
C. Association between perceived product quality and purchase decision
Perceived product quality was positively and significantly correlated with purchase decision (r = 0.487, p < 0.001), a moderate association (Table 3). Respondents also gave direct support to this link: 62.2% agreed that their perception of product quality directly influences their decision to purchase (mean = 3.66). Perceived product quality was positively correlated with perceived trust (r = 0.398, p < 0.001) and negatively correlated with perceived risk (r = −0.276, p < 0.01). These correlations are well below 0.80, so the three perceptions are related but distinguishable.
| Variable | PQ with variable (r) | p-value | Direction |
|---|---|---|---|
| Purchase decision | 0.487 | < 0.001 | Positive, moderate |
| Perceived trust | 0.398 | < 0.001 | Positive, moderate |
| Perceived risk | −0.276 | < 0.01 | Negative, weak |
Table 3: Pearson correlations between perceived product quality and other study variables (N = 90)
Source: Field data (2026). PQ = perceived product quality. Correlations are two-tailed.
D. Influence of perceived product quality on purchase decision
In the multiple regression model, VIF values ranged from 1.19 to 1.32, showing no multicollinearity problem, and residuals were approximately normal with no evident heteroscedasticity. The model was statistically significant, F(3, 86) = 17.184, p < 0.001, and perceived product quality, perceived trust and perceived risk together explained 37.5% of the variance in purchase decision (R² = 0.375; adjusted R² = 0.353). Holding perceived trust and perceived risk constant, perceived product quality had a significant positive effect on purchase decision (B = 0.276, 95% CI 0.095–0.457; β = 0.279, t = 3.033, p = 0.003) (Table 4). A one-point increase in perceived product quality on the five-point scale was therefore associated with a 0.28-point increase in purchase decision. Perceived trust was the strongest predictor (β = 0.334), and perceived risk had a significant negative effect (β = −0.241). The hypothesis that perceived product quality has a significant influence on customers’ purchase decisions was therefore supported.
| Predictor | B | SE | β | t | p | VIF |
|---|---|---|---|---|---|---|
| (Constant) | 1.052 | 0.312 | 3.372 | 0.001 | ||
| Perceived product quality | 0.276 | 0.091 | 0.279 | 3.033 | 0.003 | 1.32 |
| Perceived trust | 0.318 | 0.084 | 0.334 | 3.786 | < 0.001 | 1.28 |
| Perceived risk | −0.219 | 0.079 | −0.241 | −2.772 | 0.007 | 1.19 |
Table 4: Multiple regression of purchase decision on perceived product quality, trust and risk (N = 90)
Source: Field data (2026). Dependent variable: purchase decision. R = 0.612, R² = 0.375, adjusted R² = 0.353, F(3, 86) = 17.184, p < 0.001. The 95% confidence interval for B of perceived product quality (0.095–0.457) was calculated from B, SE and 86 degrees of freedom.
Discussion
This study found that perceived product quality significantly influences customers’ purchase decisions in the digital retail environment of the Mtu Outfit Association. Quality perceptions were generally favourable (M = 3.69) and were positively associated with purchase decision, both on their own (r = 0.487) and after accounting for perceived trust and perceived risk (β = 0.279, p = 0.003). This is consistent with the Theory of Perceived Risk, in which perceived quality works as a risk-relieving factor: customers who believe they will receive a good product face less performance uncertainty and are more likely to complete a purchase (Bauer, 1960; Featherman & Pavlou, 2003). The positive correlation between quality and trust and the negative correlation between quality and risk point in the same direction, although the regression shows that quality retains a distinct effect beyond them.
The result agrees with earlier studies reporting that perceived quality of product information shapes online purchase behaviour (Kim & Lennon, 2008; Pavlou & Fygenson, 2006) and with the broader view that perceived quality is a central element of consumers’ value judgements (Zeithaml, 1988). It extends this evidence to an informal, social-media-based market, where traders operate without standardised listings, verified seller profiles or formal return policies. In such an environment customers rely heavily on what traders show and say, so the credibility of that information carries particular weight.
The item-level results show where the weakness lies. Satisfaction with the quality of items actually received (PQ3, 68.9%) and overall quality (PQ1, 73.3%) were rated more favourably than the accuracy of online images and descriptions (PQ2, 57.8%) and the match between advertised and delivered products (PQ4, 53.3%). This suggests that the products themselves are largely meeting expectations but that the way they are presented online does not always allow customers to anticipate this with confidence. Because clothing quality depends on fabric, colour and fit, which photographs often convey poorly, closing this presentation gap offers traders a low-cost way to strengthen the positive effect of quality on purchase decisions. Where formal reviews are absent, word of mouth from past customers is likely to remain an important substitute signal of quality (Chevalier & Mayzlin, 2006).
Perceived trust had a larger standardised effect than perceived product quality (β = 0.334 versus 0.279), and the model explained 37.5% of the variance in purchase decision, so product quality is one of several influences. Factors not measured here, such as price, product variety, peer recommendation and platform convenience, probably account for part of the remaining variance.
A. Strengths and limitations
A strength of this study is its focus on an informal digital retail setting that is under-represented in the literature, together with the use of adapted, reliable measurement scales (α = 0.80 for product quality) and a high effective response rate (90.0%). Limitations should nevertheless be noted. The sample of 90 valid responses is smaller than the approximately 300 indicated by the sample size calculation, which reduces precision, as shown by the wide confidence interval for the quality coefficient (0.095–0.457). The study covered one trader association in one market and one product category, so generalisation should be cautious. Perceptions were self-reported and may be affected by recall or social desirability bias, and the cross-sectional design permits conclusions about association but not about the causal direction or stability of the relationship.
B. Implications for policy and practice
For traders, the findings indicate that investment in accurate, consistent product photography, close-ups of fabric, clear size and colour information and honest descriptions is likely to improve purchase decisions at little cost. The Association could adopt a minimum standard for digital product presentation and encourage satisfied customers to share their experiences. For regulators such as the Tanzania Communications Regulatory Authority and the Fair Competition Commission, the results support light-touch guidance on accurate product representation in informal digital retail, which would reduce information asymmetry without imposing heavy compliance burdens on small traders.
Conclusions and recommendations
Perceived product quality has a significant positive influence on customers’ purchase decisions in the digital retail environment of the Mtu Outfit Association, Kariakoo Market, and this influence persists after controlling for perceived trust and perceived risk. Customers generally think well of the quality of the clothing they receive, but they are less sure that online images and descriptions represent the products accurately. This gap between presentation and delivered product is the main quality-related weakness in the digital purchase experience.
Traders are therefore recommended to improve the accuracy and consistency of product photography and descriptions so that advertised items match delivered items. The Association should establish a shared minimum standard for digital product presentation, and regulators should consider light-touch guidance on accurate product representation in informal digital retail. Future research should replicate the study in other trader associations and product categories, use larger samples, and examine additional influences such as price and peer recommendation.
Acknowledgements
The author acknowledges the leadership, traders and customers of the Mtu Outfit Association at Kariakoo Market, Dar es Salaam, who participated in the study.
Conflicts of interest
The author declares no conflicts of interest.
*****