
Introduction
The history of women’s education in modern India began with the Asiatic Society and with the schools and training centres established by Cynthia Farrar, an American missionary; the first training centre was started under her supervision in 1824 in Ahmednagar. Savitribai Phule received her training at the Pune and Ahilyanagar (Ahmednagar) centres and later founded many girls’ schools, maternity homes, widow shelters, and orphanages in Maharashtra, employing many women in these centres. Jyotiba Phule and Savitribai Phule are pioneers of the modern system of school education for women, and of sustainable and employment-oriented education in India. The couple trained many health workers, teachers, writers, social workers, nutritionists, and childcare workers. They also encouraged widow remarriage and initiated the protection of the girl child through several Balika Pratibandhak Grih. At the request of Jyotiba Phule and his Satyashodhak Samaj, British committees recommended scholarships for women. Bethune College for Women was established in 1879, followed by Queen Mary’s College in 1914, Lady Hardinge College in 1916, Indraprastha College in 1924, and Isabella College for Women in 1870. The initial beneficiaries were 21 elite-class women at Bethune College.
Dr. Ambedkar proposed crucial concepts such as “compulsory education for all,” “labour welfare,” “decent employment,” and “democratic socialism” to achieve even economic growth and balanced regional development across states. He had a broad perspective on the global economy and closely observed the monetary system, taxation, trade, and the burden of poverty in the Indian context. In agriculture and corporations, he favoured collective ownership, the nationalisation of land, and state-controlled enterprises. He rejected Marxism, being aware that mere political democracy is not possible without social democracy and social empowerment, and he favoured achieving change through constitutional and democratic means rather than aggressive revolt.
In the nineteenth and early twentieth centuries, many social evils were prevalent in Indian society, including child marriage, polygamy, and widow burning. In 1929, the Sharda Act was introduced to restrain child marriage under the viceroyalty of Lord Irwin. Madan Mohan Malaviya strongly opposed the Sharda Act and the Age of Consent Bill. The first women’s college and the Hindu Code Bill were also opposed by both of them; the succession and share of property for women was a crucial aspect of the Hindu Code Bill. Following the Child Marriage Restraint (Amendment) Act, 1949, the minimum age of marriage for girls was raised to 15 years, and in 1978 it was further raised to 18 years. The Prohibition of Child Marriage Act was enacted in 2006, after which India witnessed a reduction in the number of child marriages, and the Prohibition of Child Marriage (Amendment) Bill, 2021, was introduced in the Lok Sabha on 21 December 2021. Child marriage is an obstacle to the socio-economic progress of women in the country; West Bengal and Jharkhand reported the largest numbers of child marriages in India. Many girls have been able to complete their secondary education following the restriction on child marriage. Domestic-violence legislation was introduced in India in 2005, and the Bengal Sati Regulation was introduced in 1829. Devadasi, dowry, and witch-hunting cases are still traced across the north of India and in many parts of southern India.
On one hand, many women join their traditional family occupations and agricultural fields as temporary daily-wage labour. On the other, non-paying or low-paying jobs are offered to women in the unorganised sector. The Payment of Wages Act, the rights of women workers, equal remuneration for equal work, and the Factories Act have supported women in the organised sector. Dr. Ambedkar drafted many landmark laws for women workers in India, such as the Mines Maternity Benefit Act, the Women Labour Welfare Fund, the Women and Child Labour Protection Act, maternity benefit for women labour, and the restoration of the ban on the employment of women in underground work in coal mines. The Constitution guarantees the right to work for all citizens, including women and marginalised groups, and the influence of the Indian legislative framework is strongly visible across the SAARC nations. Despite these facts, 50% of women in the country are not paid for their work, according to the Periodic Labour Force Survey (2021-2022).[1] The Vishaka Guidelines and the POSH framework were introduced to protect women at the workplace. It is therefore important to understand workplace dynamics, employment and education statistics, strong labour laws, and the security of women at work. In some areas, the entry of women is still prohibited, or they are offered only low-profile entry-level jobs in a male-dominated environment. In business and entrepreneurial activity, the participation of women is less than 10% in the state. Land-ownership statutes in most states are not favourable to women in India, and the transfer of property to a woman successor is not easy.
Although India has a rich legacy of exports in textiles, indigo, leather, jute, spices, and handicrafts, economists have been slow to recognise the role of the marginalised in these sectors. Historical trade centres such as Kanpur, Varanasi, Aligarh, Agra, and Moradabad are concentrated in Uttar Pradesh.[2] Women’s employment is predominant in the leather sector, accounting for approximately 31% of the workforce in the country,[3] and 37% of women are paid less than men. Owing to caste stigma, however, these workers lack the necessary facilities, respect, and support for production and distribution. The recent reduction in leather exports has directly affected the demand for labour in these areas. The labour-force participation of women is lowest in Bihar and Uttar Pradesh. Uttar Pradesh is home to 55% (32,473) of India’s manual scavengers, mostly women. A large number of waste-pickers live in the state, of whom 84.5% are from marginalised sections, and more than 75% of Dalit women face problems in accessing health care. According to the Global Multidimensional Poverty Index 2021, 94 million Dalits out of 283 million live in multidimensional poverty.[4] Many women are employed in casual work in retail, apparel, hospitals, and education at lower salaries. The rise of digital platforms has expanded the number of gig workers in India: within South Asia, India (around 24 million) and Bangladesh (over 600,000) account for a substantial share of the gig economy.[5] Many qualified people are forced to work as gig workers in the absence of employment generation in the primary sectors, and South Asian countries are home to millions of international migrants.
The main purpose of this article is to review the status of women in higher education and employment in Uttar Pradesh. The article is based on secondary data collected from AISHE, Economic Surveys, employment reports, and the Ministries of Health and Employment. SAARC nations share many similar attributes and social issues relating to the progress of women, facing several common problems of gender, social, and economic inequality. The present study investigates the progress of women in Uttar Pradesh and the connection between that progress and the wider SAARC region.
Research Methodology
This descriptive study is based on secondary data. Its main objective is to analyse the status of women’s employment and education (from 2012 onwards) in Uttar Pradesh and to observe the impact of women’s progress in India on the SAARC nations. Before examining the role of women in the Indian economy, it is essential to understand the past performance of women in one of the largest states, especially in education and employment. The relevant data are drawn from the reports of the All India Survey on Higher Education[6] and from SAARC reports on global gender gaps, higher education, and employment.
Literature Review
Women’s literacy has been poor in Uttar Pradesh since independence. The gross enrolment of women was less than 1% in India before 1950 and less than 30% until 1990; it then increased gradually in four states where the Bahujan movement was gaining strength. Economic reforms in India since the early 1990s have tended to widen the gap between Uttar Pradesh and other wealthier states.[7] Improvement in the state was observed after 2000, in education, employment, health, law, and administration. There are currently 19 women Vice-Chancellors in Uttar Pradesh, the highest in India (followed by Tamil Nadu and Maharashtra). The gross enrolment ratio was highest in Uttar Pradesh until 2014 and then declined until 2022, and the gap between the gross enrolment ratios of marginalised and unreserved women reached a minimum in 2011-2012, as did the gap between the ratios for women and men. In 2015, SEBI introduced guidelines requiring companies to include women on their boards of directors in order to improve the representation of women, although only 76% of companies appointed three or more directors.[8] Despite this, the labour participation of women was around 32% in 2023,[9] and at present 86% of women in rural areas and 53% of women in urban areas are self-employed.[10]
According to the 2011 Census, Uttar Pradesh is the source of the largest inter-state migration in India. According to a report in the Journal of Migration Affairs, around 49% of migrants from Uttar Pradesh were women, of whom approximately 4.4% migrated for employment and economic reasons, nearly double the all-India average of 2.5%.[11] Tamil Nadu, Maharashtra, Gujarat, and Uttar Pradesh have the largest numbers of registered manufacturing workers in India.[12] It is therefore essential to analyse the status of women’s employment and education in Uttar Pradesh. India has also made substantial progress in human development: its HDI improved from 0.427 in 1990 to 0.645 in 2020, the fastest average annual growth among the SAARC countries during that period,[13] which makes it important to identify the key areas driving this growth.
Findings and Interpretations
Based on secondary data, the graphs and tables in this section present a global perspective, a SAARC overview, and an Indian perspective.
A. Women in Higher Education
The gross enrolment ratio of the United States and China is higher than the world average, whereas in India it is lower. India and China were at almost the same level in 2000, but, owing to Chinese education policy, gross enrolment in higher education in China grew very quickly and crossed the world average. Gender, women’s leadership, intersectionality, women’s entrepreneurship, the contribution of women to GDP, the direct and indirect costs of women in the economy, and the contribution of marginalised women are among the least-discussed topics in South Asia. Traditionally, marginalised women were an integral part of agricultural work in most South Asian countries and were actively engaged in the textile, jute, coal, and leather industries, but as labourers rather than as owners or entrepreneurs; their contribution is neglected and is often not even counted when they are employed as contract or bonded workers. The political representation of women has played an important role in India, Afghanistan, Bangladesh, Pakistan, Nepal, Bhutan, and Sri Lanka, yet only Bhutan and India follow policies addressing the gender gap in higher education and establishing equality in education. In the absence of guidelines on educational content, social media, cinema, texts, and books are filled with misogynistic, gender-biased, and male-dominated content, which is used even on digital platforms and in study material. Many women are unaware of their rights and are trained to tolerate crime in the name of culture and tradition, and a large number believe that education and employment are not meant for women. Several traditions and a patriarchal setup are identified as barriers to women’s progress.
Graph 1: Gross Enrolment Ratio in Higher Education
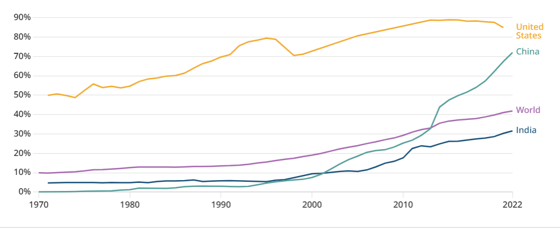
Source: World Bank Data.
Overall, the gross enrolment ratio is poor in the Sub-Saharan region and across South Asia. SAARC academic and institutional collaborations have been initiated to enhance the educational and economic development of member nations. India ranks lowest among 16 countries (SAARC and BRICS), with a Female Workforce Participation Rate (FWPR) of 24.8%. South Asia is one of the most socio-economically backward regions in the world in terms of poverty, illiteracy, malnutrition, and unemployment; roughly 25% of the world’s population is concentrated in this area, where regional economic cooperation is needed. Intra-South-Asian migration for education and employment is a new and dynamic challenge for the SAARC nations. A large population is subject to human trafficking worldwide, and 71% of victims are women from South Asia and Central Asia. According to the UNODC report on trafficking in persons, the most common forms are sexual exploitation (79%) and forced labour (18%);[14] most victims were trafficked from India or neighbouring countries. The largest number of human-trafficking cases is registered in West Bengal, while the largest numbers of kidnappings and abductions were reported in Madhya Pradesh, Delhi, and Uttar Pradesh during 2014-15.[15] Marginalised women constitute a large share of human-trafficking victims from India. It is therefore important to analyse the conditions of women in these areas with a broader perspective: improvements in education, employment, health, and legislation can help to empower them, and a special focus on multidimensional poverty, intersectionality, and marginalised women can be effective. The identification of key areas and strategic planning is used by only a few planners and governments, as discussed in the relevant sections; policy-level changes, community involvement, and local initiatives are suggested in the final section.
Graph 2: Countries with a Lower Female Participation Rate in the Workforce (2022)
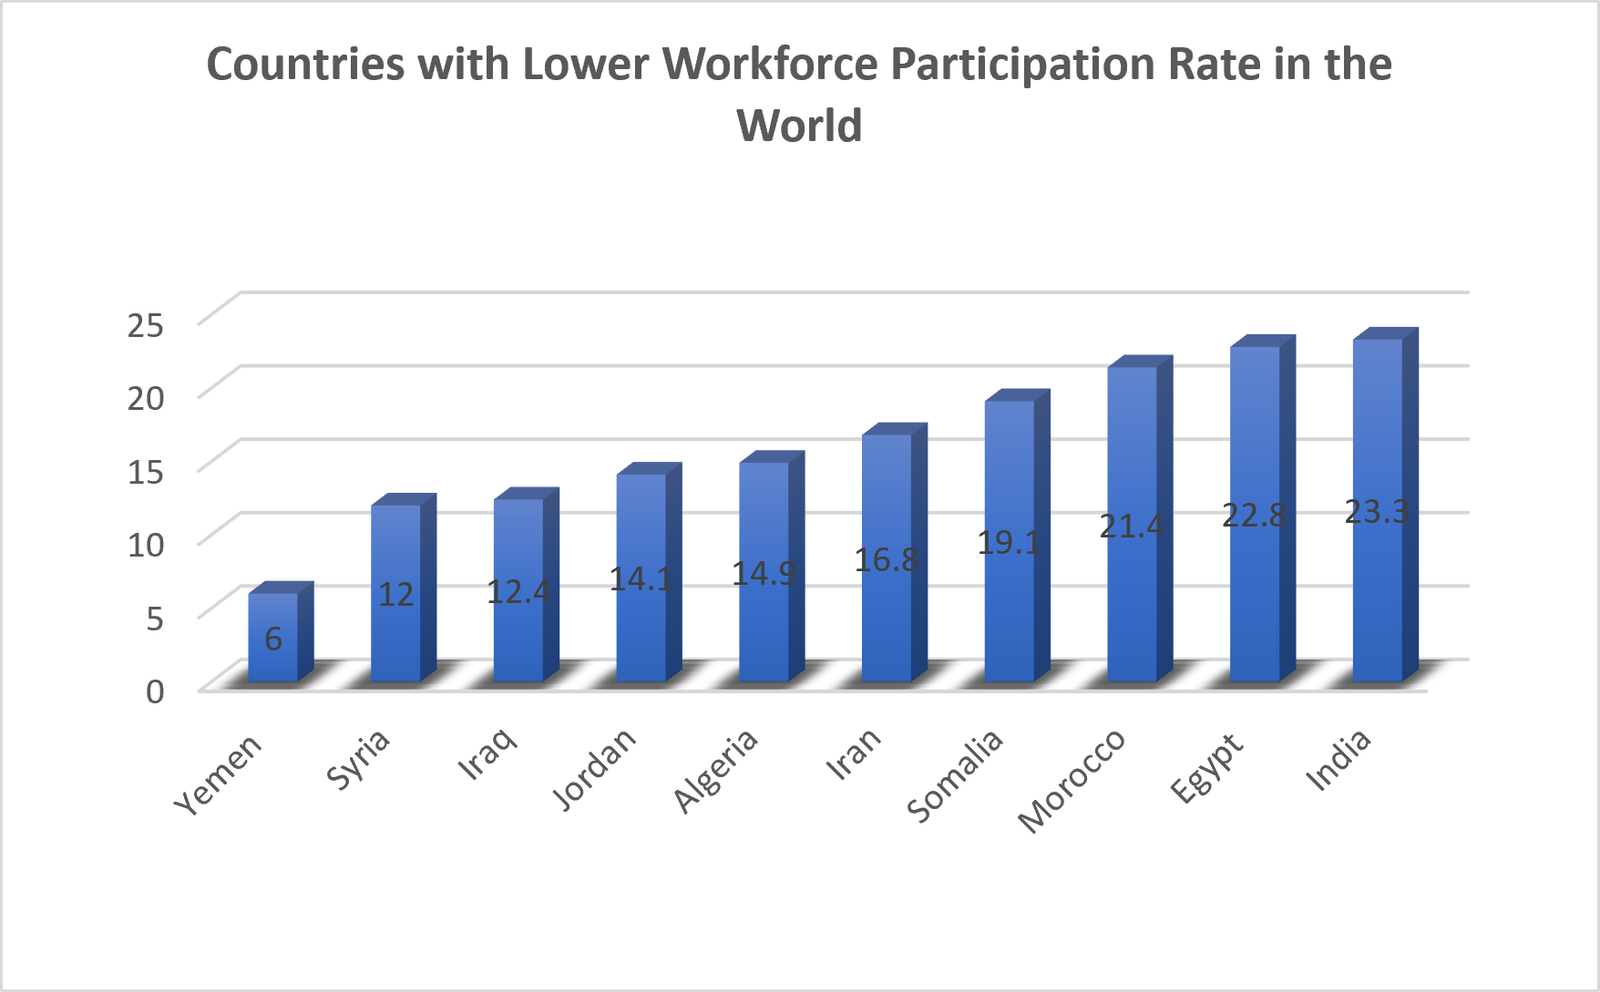
Source: The Global Economy.
A few countries show the lowest female work-participation rates in the world: Yemen, Syria, Iraq, Jordan, Algeria, Iran, Somalia, Morocco, Egypt, and India. The financial, economic, and social conditions of women are unsatisfactory across South Asia, the Middle East, and Sub-Saharan Africa. The participation of women is low in India, which is included among the ten countries with a poor female participation rate; at the same time, the World Bank and other agencies provide large grants in the name of women and the underprivileged in this region.
According to a recent report on sustainable employment prepared by the Azim Premji Foundation, the number of women in own-account self-employment has increased nearly fourfold since 2017.[16] Many women are engaged in unpaid work or receive only small remuneration. The population of working-age women (15-60 years) is highest in Uttar Pradesh, at over 57 million, exceeding the entire populations of countries such as Canada, Australia, Malaysia, and South Korea. The future of the country and of South Asia therefore depends on the progress of women in large Indian states, including Uttar Pradesh.
B. HDI Rank and Women in Parliament
The HDI is considered an indicator of a country’s overall development, while the representation of women in decision-making is an indicator of gender parity in political bodies and of democracy. Bangladesh and Bhutan have shown remarkable progress over the last ten years, and India has shown a 4% increase in the number of women in Parliament. Notably, Uttar Pradesh sends the largest number of women to the Indian Parliament and to its assembly. Parliamentary and legislative bodies are important in sanctioning educational funds, approving policy decisions, and ensuring execution and follow-up; sound representation with active leadership is therefore a core element of the progress of women in education, employment, and entrepreneurship. The mere introduction of a scheme can benefit only a limited number of women, whereas their collective participation can increase its success rate.
Table 1: SAARC Countries’ HDI Rankings and Participation of Women in Parliament (2012-2022)
| Country | HDI Rank 2012 | HDI Rank 2022 | Difference | Women in Parliament 2012 (%) | Women in Parliament 2022 (%) | Difference |
| Afghanistan | 177 | 182 | -5 | 27.7 | 27.5 | -0.2 |
| Bangladesh | 145 | 129 | +16 | 19.7 | 20.3 | +0.6 |
| Bhutan | 136 | 125 | +11 | 8.5 | 8.5 | 0 |
| India | 139 | 134 | +5 | 11 | 15 | +4 |
| Nepal | 148 | 146 | +2 | 33.6 | 29.2 | -4.4 |
| Pakistan | 161 | 164 | -3 | 21.3 | 22.5 | +1.2 |
| Sri Lanka | 86 | 78 | +8 | 5.8 | 5.8 | 0 |
Source: Self-compiled from global HDI rankings.
C. Employment of Women in SAARC Nations
The status of women’s employment and labour-force participation is improving, but only in a few SAARC nations. The gap between male and female labour-force participation was smaller in 2012 in India and Nepal, whereas by 2022 it had increased in both. Bhutan is the only country in which the gap between male and female workforce participation has been minimised, and India is experiencing the largest decline in female workforce participation among all the SAARC countries.
Table 2: Labour Force Participation (%) in SAARC, Ages 15-64
|
Country |
2012 Male | 2012 Female | 2012 Diff. | 2022 Male | 2022 Female | 2022 Diff. | Gap Trend |
|
Afghanistan |
72 | 5 | 67% | 79 | 17 | 63% | Reduced |
|
Bangladesh |
84 | 36 | 48% | 84 | 47 | 37% | Reduced |
|
Bhutan |
75 | 55 | 20% | 67 | 66 | 1% | Reduced |
| India | 80 | 31 | 49% | 81 | 28 | 53% |
Increased 4% |
| Nepal | 56 | 29 | 27% | 60 | 27 | 33% |
Increased 6% |
| Pakistan | 83 | 25 | 58% | 81 | 23 | 58% |
Same |
| Sri Lanka | 78 | 36 | 42% | 75 | 36 | 39% |
Reduced |
Source: Self-compiled from ILO data.
Unemployment, migration, and poverty have severely affected the economy of the largest state in South Asia, and the overall impact is strongly visible on the entire South Asian economy in the long run. The labour-force participation rate (LFPR), workforce participation rate (WPR), and unemployment rate for 2012 and 2022 are compared below for India and Uttar Pradesh. The gap between male and female labour-force participation, and between male and female workforce participation, is widening in both Uttar Pradesh and India, and the unemployment rate has almost doubled over the period.
Table 3: LFPR, WPR, and Unemployment Rate in Uttar Pradesh and All India (% of population)
|
Region / Year |
LFPR Male | LFPR Female | LFPR Persons | WPR Male | WPR Female | WPR Persons | Unemp. Persons |
|
Uttar Pradesh 2011-12 |
50.4 | 16.3 | 33.8 | 49.5 | 16.1 | 33.3 | 1.77 |
|
Uttar Pradesh 2020-21 |
54.4 | 16.7 | 36.0 | 51.9 | 16.2 | 34.5 | 4.17 |
|
Uttar Pradesh 2021-22 |
53.1 | 18.7 | 36.2 | 51.4 | 18.4 | 35.1 |
3.04 |
| All India 2011-12 | 55.6 | 22.5 | 39.5 | 54.4 | 21.9 | 38.6 |
2.28 |
| All India 2020-21 | 57.5 | 25.2 | 41.6 | 54.9 | 22.4 | 39.8 |
4.33 |
| All India 2021-22 | 57.3 | 24.8 | 41.3 | 54.8 | 24 | 39.6 |
4.12 |
Source: Self-compiled from MOSPI data.
The employment share of women in the primary sector is higher, while employment in the tertiary sector and in contract jobs is low in Uttar Pradesh, and the share of women in the tertiary sector has been decreasing in recent years. When calculating income, employment, and economic progress, therefore, the state’s population is a dominant force in both the Indian and the wider SAARC economy.
Table 4: Percentage Share of Male and Female Employment by Sector in Uttar Pradesh
|
Sector |
Gender | % Distribution |
|
Agriculture |
Male | 43.1 |
|
Agriculture |
Female | 78.5 |
|
Secondary |
Male |
28.5 |
| Secondary | Female |
7.6 |
| Tertiary | Male |
28.4 |
| Tertiary | Female |
8.5 |
Source: Self-compiled from the Periodic Labour Force Survey 2022-23.
D. Higher Education and Women in Uttar Pradesh
The gross enrolment of women has almost stagnated since 2017 in Uttar Pradesh, whereas steady growth has been observed in the gross enrolment ratio of women in India since 2017. Moreover, since the pandemic the gap between the gross enrolment ratios of marginalised women and other women has been widening in the state, even though marginalised women constitute fifty per cent of the population of the state.
Graph 3: Gross Enrolment Ratio of Women in India and Uttar Pradesh (2012-2022)
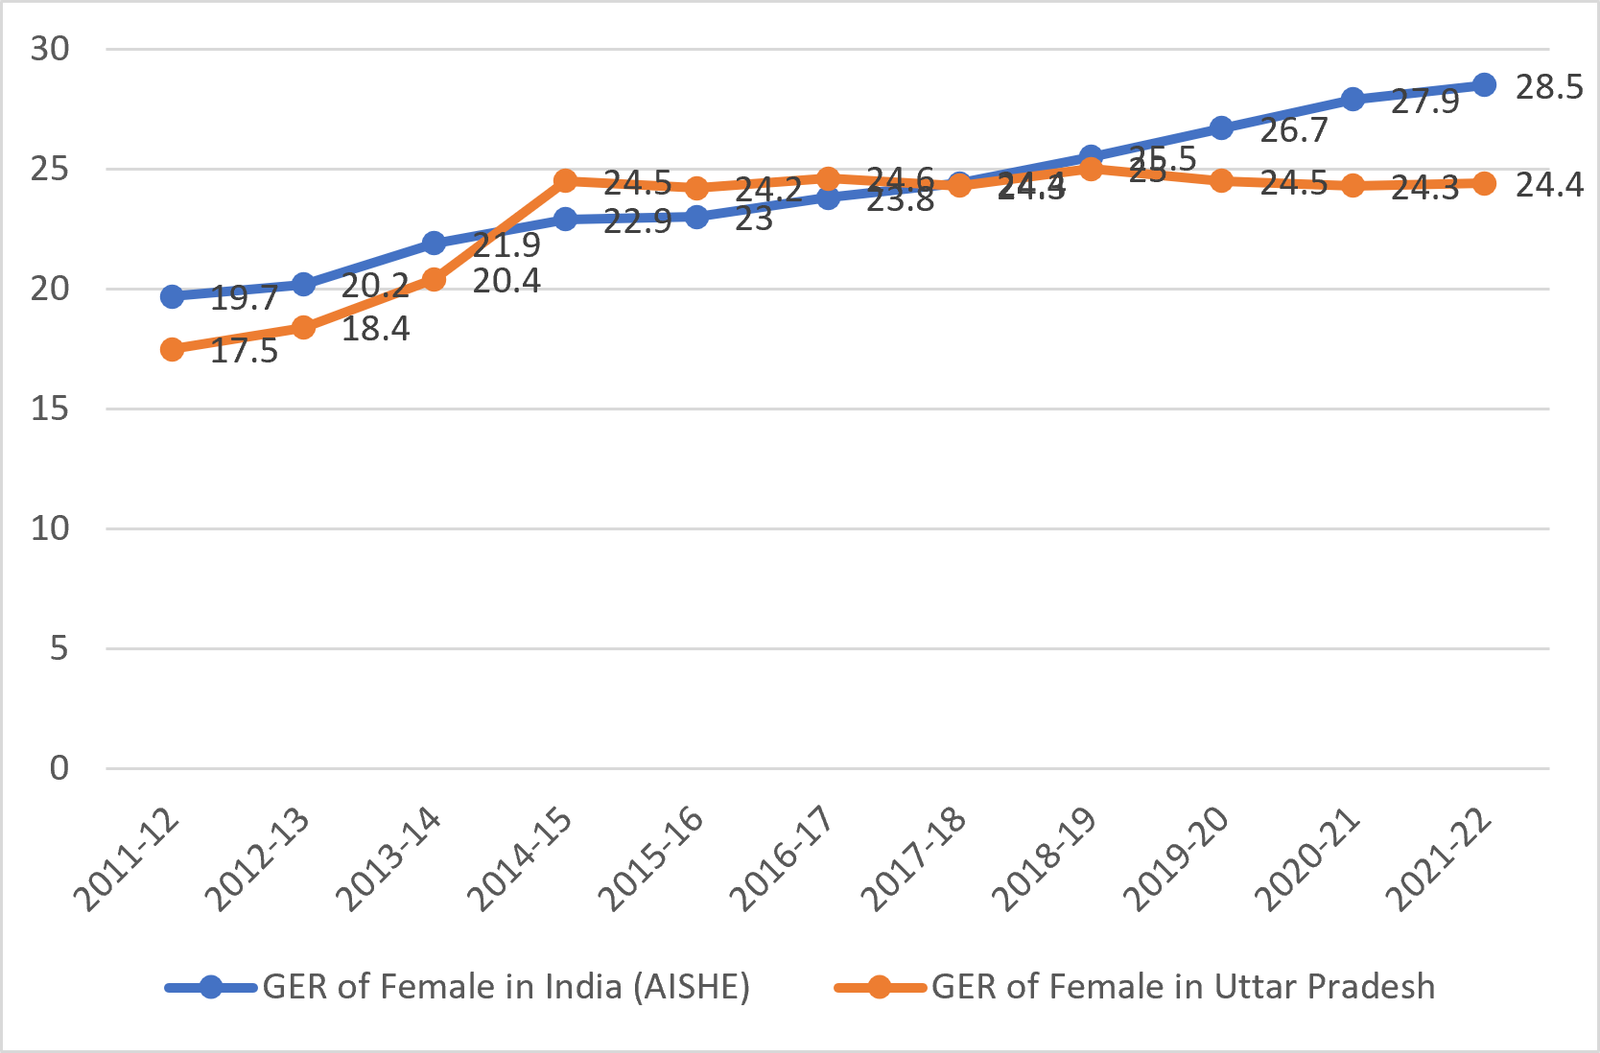
Source: Self-compiled from MOE / AISHE data and reports.
On one hand, gender parity in workforce participation is declining, and inequality between genders has increased in recent years; on the other, the difference between male and female labour-participation ratios is reducing. The simplest interpretation is that regular employment and decent work are not offered to many women, who are forced to opt for daily-wage or petty work.
Table 5: Gender Parity Index in Uttar Pradesh and Labour Force Participation Rate of Males and Females
|
Year |
GPI | LFPR (Male) | LFPR (Female) | Difference |
|
2017-18 |
1.09 | 58.0 | 7.8 | 50.2 |
|
2018-19 |
1.17 | 54.7 | 7.4 | 47.3 |
| 2019-20 | 1.20 | 57.5 | 9.7 |
47.8 |
| 2020-21 | 1.09 | 61.4 | 12.8 |
58.6 |
| 2021-22 | 1.02 | 59.5 | 15.3 |
44.2 |
Source: AISHE Report 2021-22.
E. Self-Employed Women
The number of self-employed women has been increasing in the state since 2018, which is not a positive trend. The state is not generating enough regular or casual employment for the largest population in South Asia, which is needed for the progress of women in the region. A sharp decline is observed in the number of regular and casual women employees, and the decline in the five-year moving average of regular employment in Uttar Pradesh is also displayed in the graph (dotted line).
Graph 4: Distribution of Female Workers in Different Types of Jobs (Five Years)
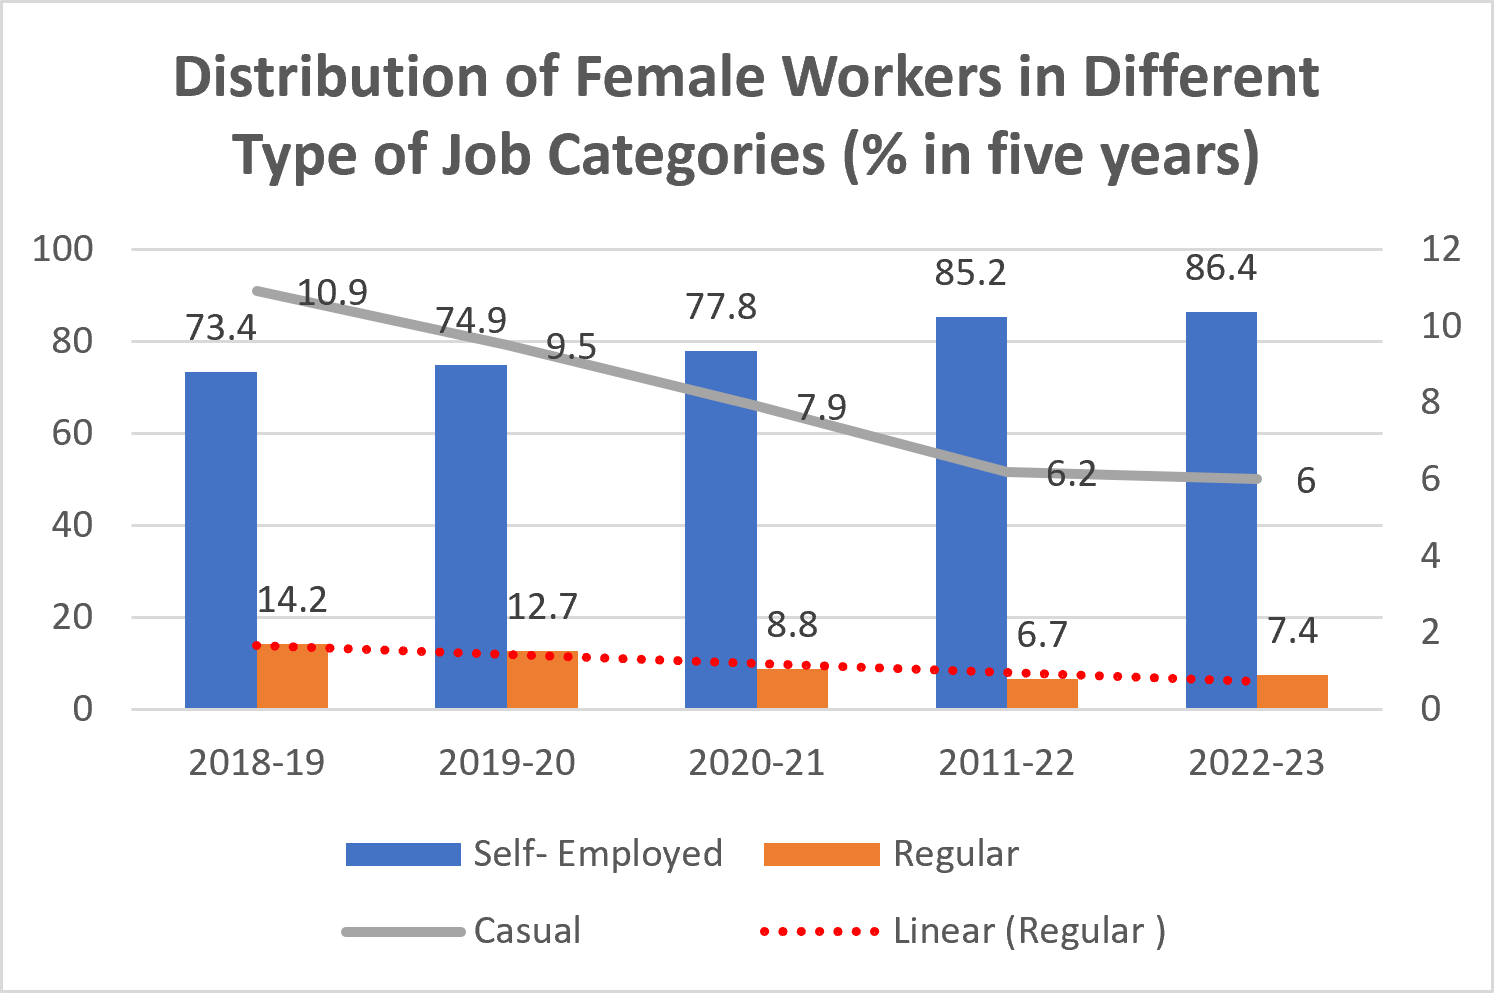
Source: Periodic Labour Force Survey 2022-23.
F. Crime and Women
The gross enrolment ratio trends in Uttar Pradesh reveal a sharp increase in women’s enrolment in higher education until 2011 in both Uttar Pradesh and India. There is a strong likelihood that crime and the higher education of women are closely connected: until 2014, Uttar Pradesh had the largest enrolment of girl students in the country, including in professional, technical, medical, and vocational institutes, and the number of educational and special institutions was highest in the state between 2008 and 2011. Following a change in governance, women began to drop out of college at the same time as crime was increasing in the state, and crime almost doubled between 2013 and 2022, despite Uttar Pradesh having the largest number of women representatives in Parliament and the largest number of women Vice-Chancellors.
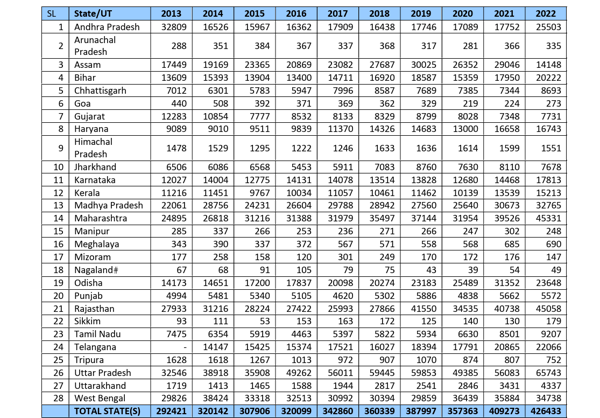
Table 6: Crime in Different States (2013-2022)
Source: NCRB data compiled from various reports.
Crime against women increased from 2012 onwards in Uttar Pradesh, and the dropout rate of students also increased. During 2014-19, the largest number of cases under the SC/ST Act, including rape and assault, was registered in Uttar Pradesh, according to the National Crime Records Bureau, and the state reported the largest number of crimes in India against marginalised women between 2014 and 2019. Marginalised women are capable of reviving the economy but are not encouraged, trained, or supported, and crime and unsafe working conditions force them to leave their education and jobs. On the average of crimes against marginalised women between 2014 and 2019, Uttar Pradesh leads in cases relating to the prosecution of minors, rape, assault, and kidnapping.
Graph 5: State-wise Ranking of Cases Filed Against Marginalised Persons in India (2014-2019)
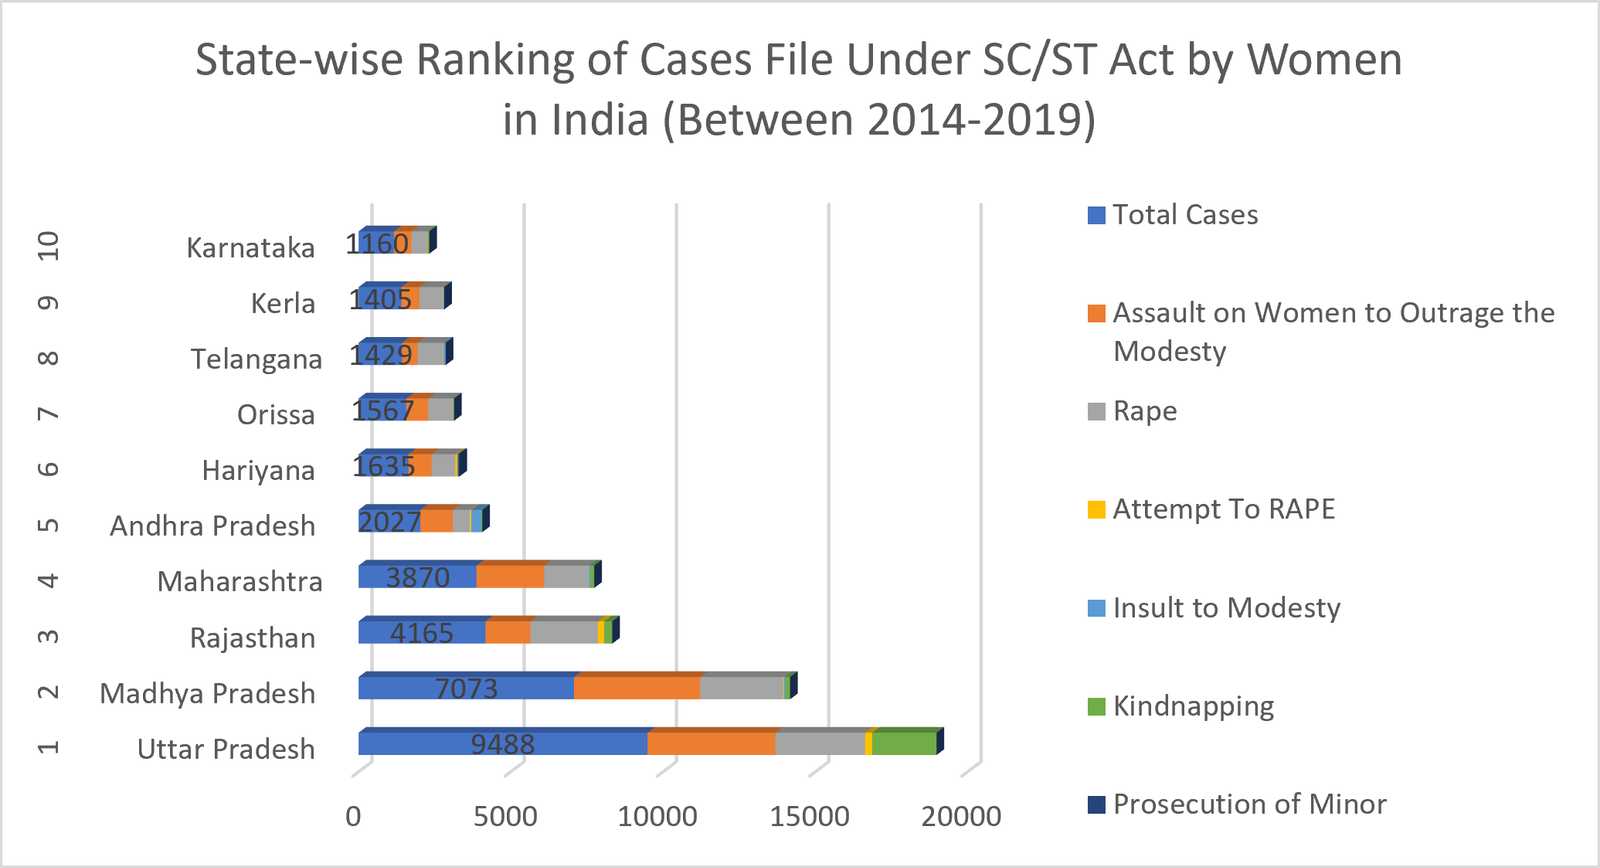
Source: NCRB data compiled from various reports.
To control crime against women, provision has existed for the inclusion of women in the police force since 1939, yet the representation of women in the police force was less than 5% between 2005 and 2013. According to the State Crime Records Bureau, Uttar Pradesh, there were 74 Mahila police stations in Uttar Pradesh in 2012; there are now more than 100 such stations in the state, with increased female staff, but crime remains at its peak.
Table 7: Women Officers in the Police Force
| Year / Region | DGP / Spl. DGP / Addl. DGP | IGP | DIG | AIGP / SSP / SP / Commdt. | Addl. SP / Dy. Commdt. | ASP / Dy. SP |
| 2012 Uttar Pradesh | 4 | 2 | 5 | 20 | 17 | 107 |
| 2012 All India | 41 | 34 | 53 | 328 | 233 | 747 |
| 2022 Uttar Pradesh | 3 | 1 | 0 | 12 | 6 | 27 |
| 2022 All India | 29 | 29 | 26 | 156 | 103 | 570 |
Source: State Crime Records Bureau, Uttar Pradesh, 2013.
G. Gender Parity in Uttar Pradesh
The present government has promoted several existing and new schemes to improve women’s leadership in education and business, and has increased the number of women participants in MGNREGA, Anganwadi, and mid-day-meal work, although these are not well-paid permanent jobs. Caste-based discrimination and patriarchal attitudes prevent many women from working in many organisations and fields. In rural areas, 88% of women are employed in agricultural or allied activities that are seasonal in nature, while in urban areas around 20% are employed in agriculture or allied activities, 16% in education, and around 15% in retail; most of these are not full-time jobs and the remuneration is very low. PLFS data indicate a widening gap in overall unemployment between males and females in Uttar Pradesh since 2018.
Uttar Pradesh is one of the leading education markets, with the largest number of higher-education institutions. The prime objective of NEP 2020 is to increase enrolment in higher education in India to 50%, which makes it important to understand the trends in higher education, government expenditure on it, and its outcomes. Government expenditure on higher education in Uttar Pradesh nevertheless ranks 17th in the country at present. According to the AISHE Report (2021-22), the top six states (Uttar Pradesh, Maharashtra, Tamil Nadu, Madhya Pradesh, West Bengal, and Rajasthan) together account for 53.3% of total student enrolment in the country; the percentage of women and men with higher education is compared across five of these states below.
Since 2011, Uttar Pradesh has had the largest number of Central Universities, State Public Universities, and Institutes of National Importance. The largest number of universities (91) is also found in Uttar Pradesh and Gujarat at present, and the largest number of colleges is situated in Uttar Pradesh (8,375), followed by Maharashtra (4,692), according to AISHE reports. Tamil Nadu and Maharashtra enrol the largest numbers of students overall, the largest numbers of female students, and the largest numbers of students in technical and professional courses in India. By population, Tamil Nadu and Maharashtra enrolled 16% and 15% of women respectively in 2023, but the gap between the male and female percentages is lowest in Uttar Pradesh among the five states. Uttar Pradesh was the third-leading state for foreign-student enrolments and the leading state for the enrolment of underprivileged and differently-abled students. According to the AISHE Report 2011-2012, Uttar Pradesh enrolled the largest number of students in higher education, and it still led in overall gross enrolment until 2021-2022. However, crime against women has increased in the state in recent years and dropouts are rising, which is a serious matter. A modest change in leadership, administration, and the representation of women in all bodies could further boost the gross enrolment ratio of women and marginalised groups in the state.
Graph 6: Percentage of Women and Men with Higher Education (2023)
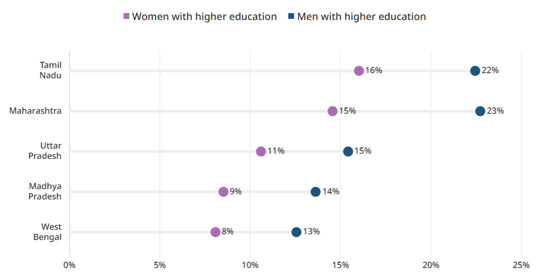
Source: AISHE reports.
The number of higher-education institutions is increasing in India, especially private universities and colleges, and as fees and education loans become costlier, many middle-class students are unable to afford the cost of education. India has a large middle-class and lower-middle-class population, and in a nuclear family girls’ education is often the first to be compromised; after the pandemic, many parents who lost their jobs found it difficult to afford private-college fees. There has nonetheless been a 17% increase in the higher-education institutes in recent years, with universities growing from 760 to 1,213 and colleges from 38,498 to 46,624.
Conclusion
Uttar Pradesh largely shapes the higher-education and employment scenario of India and of the wider South Asia. Having the largest population of women yet the lowest workforce participation of women in India is a problem area among the SAARC nations. Higher education and employment both demand a safe and peaceful environment. A large number of women are outside the education system, and most are involved either in self-employment or in agriculture. Employment opportunities in the primary and secondary sectors are limited in the state; in agriculture, collective farming can improve the employment situation, and agricultural and specialised institutions must be connected to the villages. Primary and secondary jobs empower women through job security, social security, pensions, and other benefits, while the gig economy must be regulated through a structured network, social security, and organised employment. Apart from genuinely temporary and seasonal work, social-security schemes, pensions, gratuity, and insurance must be ensured by employers. India ranks seventh in the SAARC region for the highest unemployment and third for the highest self-employment, and fourth for GDP per capita in 2024. Key result areas in the SAARC nations must therefore be identified in order to reduce inequality between genders and among social categories. The SAARC countries share many similar attributes, such as migration, unemployment, hunger, poverty, the global burden of disease, and the expansion of the gig economy, and mere collaborative and exchange programmes cannot work until community engagement and collective decision-making, such as that in Bhutan, are encouraged for development and for the eradication of these problems.
Income inequality, technology spillovers, educational reform, and the challenges of higher education are among the barriers to the progress of the SAARC countries. Migration, crime, caste-based discrimination, maternal health, social inequality, political instability, violence, drugs, terrorism, and economic disparity can be tackled through collaborative efforts and multilateral agreements. Institutions and organisations can encourage women to complete their education and to contribute to the nation. For long-term progress, regional alliance, cooperation, and cordial relations among the SAARC nations are necessary.
*****
Footnotes
[1] Periodic Labour Force Survey 2021-22, Ministry of Stat. & Programme Implementation (2022).
[2] Romesh C. Dutt, The Economic History of India (Kegan Paul, Trench, Trubner 1902), https://www.vifindia.org/sites/default/files/139217913-Economic-Hist-of-India-Under-Early-British-Rule-Vol-1-1902.pdf.
[3] Int’l Labour Org., ILOSTAT: Women, https://ilostat.ilo.org/topics/women/ (last visited 2026).
[4] U.N. Dev. Programme, Global Multidimensional Poverty Index 2021 (2021), https://hdr.undp.org/content/2021-global-multidimensional-poverty-index-mpi.
[5] The Gig Economy in South Asia, Fin. Express (2025), https://thefinancialexpress.com.bd/views/reviews/the-gig-economy-in-south-asia.
[6] Gov’t of India, All India Survey on Higher Education (AISHE) Report 2021-22, https://aishe.gov.in/aishe-final-report/.
[7] World Bank, World Development Indicators (2006), https://databank.worldbank.org/.
[8] Sec. & Exch. Bd. of India, Listing Obligations and Disclosure Requirements (2015) (requiring listed companies to appoint at least one woman director).
[9] Uttar Pradesh Employment Report (2023).
[10] Nat’l Sample Survey Office, Ministry of Stat. & Programme Implementation, https://www.mospi.gov.in/national-sample-survey-office (last visited 2026).
[11] Amit Kumar Das et al., Migration from Uttar Pradesh, J. Migration Affairs (2020).
[12] Ministry of Stat. & Programme Implementation, Employment in the Manufacturing Sector 2022-23 (2023).
[13] U.N. Dev. Programme, Human Development Report (reporting India’s HDI as 0.427 in 1990 and 0.645 in 2020).
[14] U.N. Off. on Drugs & Crime, Global Report on Trafficking in Persons (2009), https://www.unodc.org/unodc/en/data-and-analysis/glotip_2009.html.
[15] Nat’l Crime Records Bureau, Crime in India 2013-14, https://ncrb.gov.in/.
[16] Azim Premji Found., State of Working India (reporting a nearly fourfold rise in women’s own-account self-employment since 2017).