
Impact of Geopolitical Tensions on International Trade
International trade has long been regarded as the engine of global economic development, allowing nations to exchange goods, services, capital, and technology in ways that raise productivity and living standards. Over the past decade, however, the steady march of globalization has been interrupted by a wave of geopolitical tensions: trade wars, military conflicts, sanctions regimes, and diplomatic disputes have introduced new frictions into the world trading system. This paper examines the impact of geopolitical tensions on international trade, with particular attention to supply chain disruption, tariff escalation, price inflation, and the reconfiguration of trade partnerships. Adopting a descriptive and analytical approach grounded in secondary data drawn from the World Trade Organization (WTO), the International Monetary Fund (IMF), the World Bank, the United States Department of Agriculture (USDA), the Center for Strategic and International Studies (CSIS), and other authoritative sources, the study traces how recent shocks, from the United States-China trade rivalry to the Russia-Ukraine conflict and the recalibration of Indo-United States and Indo-European Union trade relations in 2026, have reshaped global commerce. The analysis shows that while geopolitical tensions consistently raise costs and uncertainty for firms and consumers, they simultaneously act as a catalyst for diversification, regional integration, and industrial self-reliance. It also shows that the legal foundations of unilateral trade measures have themselves become a source of volatility, as the invalidation and successive statutory replacement of the United States reciprocal tariff programme during 2026 demonstrates. The paper concludes with policy suggestions aimed at building more resilient, AI-enabled, and geopolitically agile supply chains, and outlines directions for future research based on primary data and sector-specific investigation.
Introduction
A. Background and Significance of the Problem
International trade is a crucial component of global economic development. Countries exchange goods, services, and technology in order to improve productivity, generate employment, and raise living standards. The post-war multilateral trading system, anchored first in the General Agreement on Tariffs and Trade (GATT) and later in the World Trade Organization (WTO), was built on the premise that deeper economic interdependence among nations would not only expand prosperity but also reduce the likelihood of conflict. For much of the late twentieth and early twenty-first centuries, globalization steadily increased that interdependence, integrating supply chains across continents and making trade more central to national economic strategy than at any earlier point.
In recent years, however, this trajectory has been challenged by a resurgence of geopolitical tension. Trade wars between major economies, military conflicts such as the Russia-Ukraine war, diplomatic disputes over technology and data governance, and an increasing willingness to deploy tariffs and sanctions as instruments of foreign policy have all disrupted global trade systems. These tensions create instability and impair the smooth functioning of international markets, forcing firms to rethink sourcing strategies, governments to renegotiate trade agreements, and multilateral institutions to reassess the rules that have historically governed cross-border commerce. The phrase "Great Re-globalization" captures this moment of transition: globalization is not disappearing, but it is being reorganized along lines that are more regional, more security-conscious, and more technologically mediated than before.
B. Statement of the Problem
The intensification of geopolitical conflict across the world has created major challenges for international trade. Five problems stand out as particularly significant for policymakers, businesses, and researchers.
Disruption of supply chains. Firms are compelled to reroute shipments, qualify new suppliers, and absorb longer lead times.
Increase in tariffs and trade restrictions. These raise the cost of cross-border transactions and distort comparative advantage.
Economic sanctions affecting trade relations. Sanctions cut off entire markets and financial channels for targeted countries and, indirectly, for their trading partners.
Uncertainty for businesses and investors. Uncertainty depresses capital expenditure and delays cross-border investment decisions.
Rising prices and inflation. Constrained supply and higher input costs are ultimately passed through to consumers.
Collectively, these issues depress global economic growth and warrant detailed study. Understanding how geopolitical tensions transmit through trade channels, and how firms, sectors, and countries respond to them, is essential to designing policies and corporate strategies capable of withstanding continued volatility.
Review of Literature
A growing body of institutional and academic literature has examined the relationship between geopolitics and trade. Reports published by the WTO have repeatedly flagged the fragmentation of trade policy along geopolitical lines. WTO Secretariat research finds that, since the outbreak of the Russia-Ukraine war in 2022, trade in goods between hypothetical "East" and "West" blocs has grown roughly four per cent more slowly than trade within those blocs, a modest but persistent divergence that is consistent with policy-driven realignment rather than with cyclical factors alone (World Trade Organization, 2023). International Monetary Fund research has modelled the macroeconomic cost of that fragmentation, estimating losses ranging from about 0.2 per cent of world GDP in a mild scenario with low adjustment costs to as much as 7 per cent under severe fragmentation with limited scope for adjustment, with losses of 8 to 12 per cent in some individual economies once technological decoupling is added (International Monetary Fund, 2023). Developing and emerging economies are generally found to bear a disproportionate share of that loss. World Bank publications have likewise emphasized the vulnerability of commodity-dependent and import-reliant developing countries to sanctions-driven and conflict-driven price shocks, particularly in energy and food markets.
Beyond the multilateral institutions, think-tank and industry research has documented firm-level adaptation. Studies from organizations such as the Center for Strategic and International Studies (CSIS) have tracked the "friend-shoring" and "de-risking" strategies adopted by multinational firms seeking to reduce exposure to single-country sourcing, especially in electronics, pharmaceuticals, and agriculture (Center for Strategic and International Studies, 2025). Trade-data monitoring services have shown uneven success across industries in diversifying away from concentrated trading partners: some agricultural commodities have found alternative buyers relatively quickly, while others remain structurally tied to a small number of markets. Sector-specific research from bodies such as the American Farm Bureau Federation and the United States Department of Agriculture (USDA) has documented how retaliatory tariffs during trade disputes can convert long-standing agricultural trade surpluses into deficits within a few years (American Farm Bureau Federation, 2025).
Financial and macroeconomic historians, including researchers associated with the Federal Reserve Bank of St. Louis, have placed current energy-market volatility in a longer historical context, comparing contemporary, geopolitically driven oil price movements with earlier shocks such as the 1973-74 Arab oil embargo, the 1979 Iranian revolution, and the 2022 Russian invasion of Ukraine. This literature generally concludes that, although nominal price spikes can appear dramatic, inflation-adjusted comparisons frequently reveal that earlier shocks were in real terms considerably larger, a finding with direct implications for how policymakers ought to calibrate their responses to present volatility. Taken together, this literature establishes that geopolitical tensions reach trade through multiple interacting channels, namely tariffs, sanctions, logistics disruption, price shocks, and investment uncertainty, and that the resulting adjustment is uneven across countries and sectors. That unevenness is what motivates the country-level and sector-level analysis undertaken in this paper.
Objectives and Scope of the Study
A. Objectives
The study pursues five objectives: to understand geopolitical tensions and their underlying causes; to analyse the impact of those tensions on international trade; to identify the factors that affect trade during periods of conflict; to examine real-life instances of trade disruption drawn from recent geopolitical events; and to evaluate the strategies available to governments and firms for reducing the negative impact of geopolitical volatility on trade.
B. Scope and Limitations
The scope of the study is defined as follows. The study focuses on global trade and on the major geopolitical conflicts of the past decade, with emphasis on developments through 2026. It covers impacts on supply chains, trade policies, tariff structures, and prices across goods, agricultural commodities, and services. It draws illustrative evidence from both developed economies, principally the United States and the European Union, and developing and emerging economies, principally India, the ASEAN members, and China. The analysis rests only on secondary data drawn from published institutional reports, trade databases, and news sources. It is limited to recent events and to publicly available information as at mid-2026, and it does not incorporate primary survey or interview data.
Research Methodology
A. Research Design
The study adopts a descriptive and analytical research design. It does not seek to establish new causal estimates. It synthesizes published data and case evidence in order to build a coherent picture of how geopolitical tensions have affected international trade in goods, agriculture, and services over the recent period.
B. Data Collection
The paper relies entirely on secondary data drawn from six categories of source: reports and databases of international organizations, including the WTO, the International Monetary Fund (IMF), and the World Bank; sector-level data from national statistical and agricultural agencies, including the USDA Foreign Agricultural Service, the USDA Economic Research Service, and the American Farm Bureau Federation; macro-financial time series from central banking sources, including the Federal Reserve Bank of St. Louis and the United States Energy Information Administration; trade-flow data compiled by monitoring services such as Trade Data Monitor and analysed by research institutions including CSIS; credit-rating and macroeconomic outlooks, including the regional growth projections published by Moody's; and research papers, journal articles, official press releases, and reporting in the financial press.
C. Method of Analysis
The study employs a combination of case-study analysis of major geopolitical events, comparative analysis of trade patterns across regions and sectors, and descriptive analysis of published economic data and trend charts. Five illustrative data visualizations and one sector-level trade table, compiled from the secondary sources listed above, are presented and interpreted in Section 5 so as to ground the discussion in observable trends rather than in assertion alone.
Geopolitical Tensions and Global Trade: An Analytical Overview
This section presents empirical evidence, compiled from secondary sources, illustrating five distinct channels through which geopolitical tensions are transmitted into the global trading system: macroeconomic growth momentum, energy markets, agricultural trade diversification, bilateral trade balances, and tariff-driven strategic repositioning. A sixth illustration presents a services-trade case study.
A. Slowing Growth Momentum in the Asia-Pacific Region
Regional growth outlooks provide an early signal of the way in which geopolitical and trade-policy pressures feed through into real economic activity. As Figure 1 shows, real GDP growth across the Asia-Pacific region is projected to slow in 2026 relative to 2025 across most of the region's major economies, including China, developing Asia, ASEAN, and developed Asia as a group. On the aggregate regional path published by Moody's Analytics, growth moderates from 4.3 per cent in 2025 to 4.1 per cent in 2026 and eases further to 3.6 per cent in 2027, so that the slowdown is projected to persist rather than to reverse within the forecast window (Moody's Analytics, 2026). India is shown maintaining comparatively higher growth than the regional average across the three-year window, reflecting its relatively lower direct exposure to the tariff and sanctions regimes affecting other regional exporters, although it is not immune to the broader slowdown.
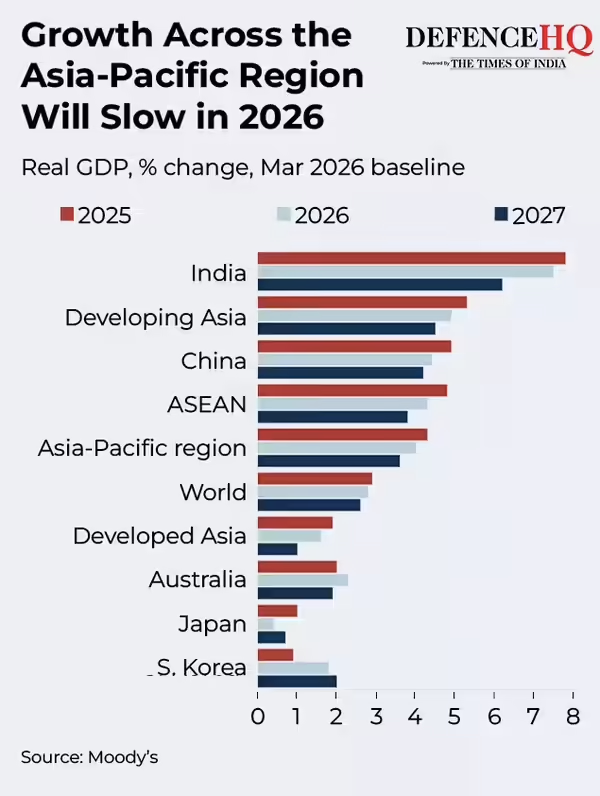
Figure 1. Real GDP growth (per cent change), Asia-Pacific economies, 2025-2027 baseline projections. Source: Moody's Analytics (2026).
The pattern illustrated in Figure 1 is consistent with the wider evidence on trade fragmentation. The WTO's March 2026 outlook projects world merchandise trade volume growth falling from 4.6 per cent in 2025 to 1.9 per cent in 2026, before a partial recovery to 2.6 per cent in 2027, with a lower path of 1.4 per cent in 2026 should elevated energy prices arising from the Middle East conflict persist (World Trade Organization, 2026). Economies most exposed to bilateral tariff escalation and to supply-chain rerouting tend to see growth downgrades concentrated in the year immediately following a tension shock, with recovery contingent on new trade arrangements taking hold. The comparatively resilient trajectory of India in these projections foreshadows the tariff and export-strategy discussion presented in Section 5.5.
B. Energy Markets and Historical Precedent
Energy markets are historically among the most sensitive channels through which geopolitical shocks are transmitted to the wider economy, given the role of oil as an input to virtually every traded good. Figure 2 places recent oil-price movements in a six-decade, inflation-adjusted context. It marks the major geopolitical events, namely the 1973-74 Arab oil embargo, the 1979 Iranian revolution, the 2008 speculative bubble, the 2010 onset of the United States fracking revolution, the 2022 Russian invasion of Ukraine, and the renewed 2026 tensions involving Iran, against the real, 2026-dollar price of a barrel of oil.
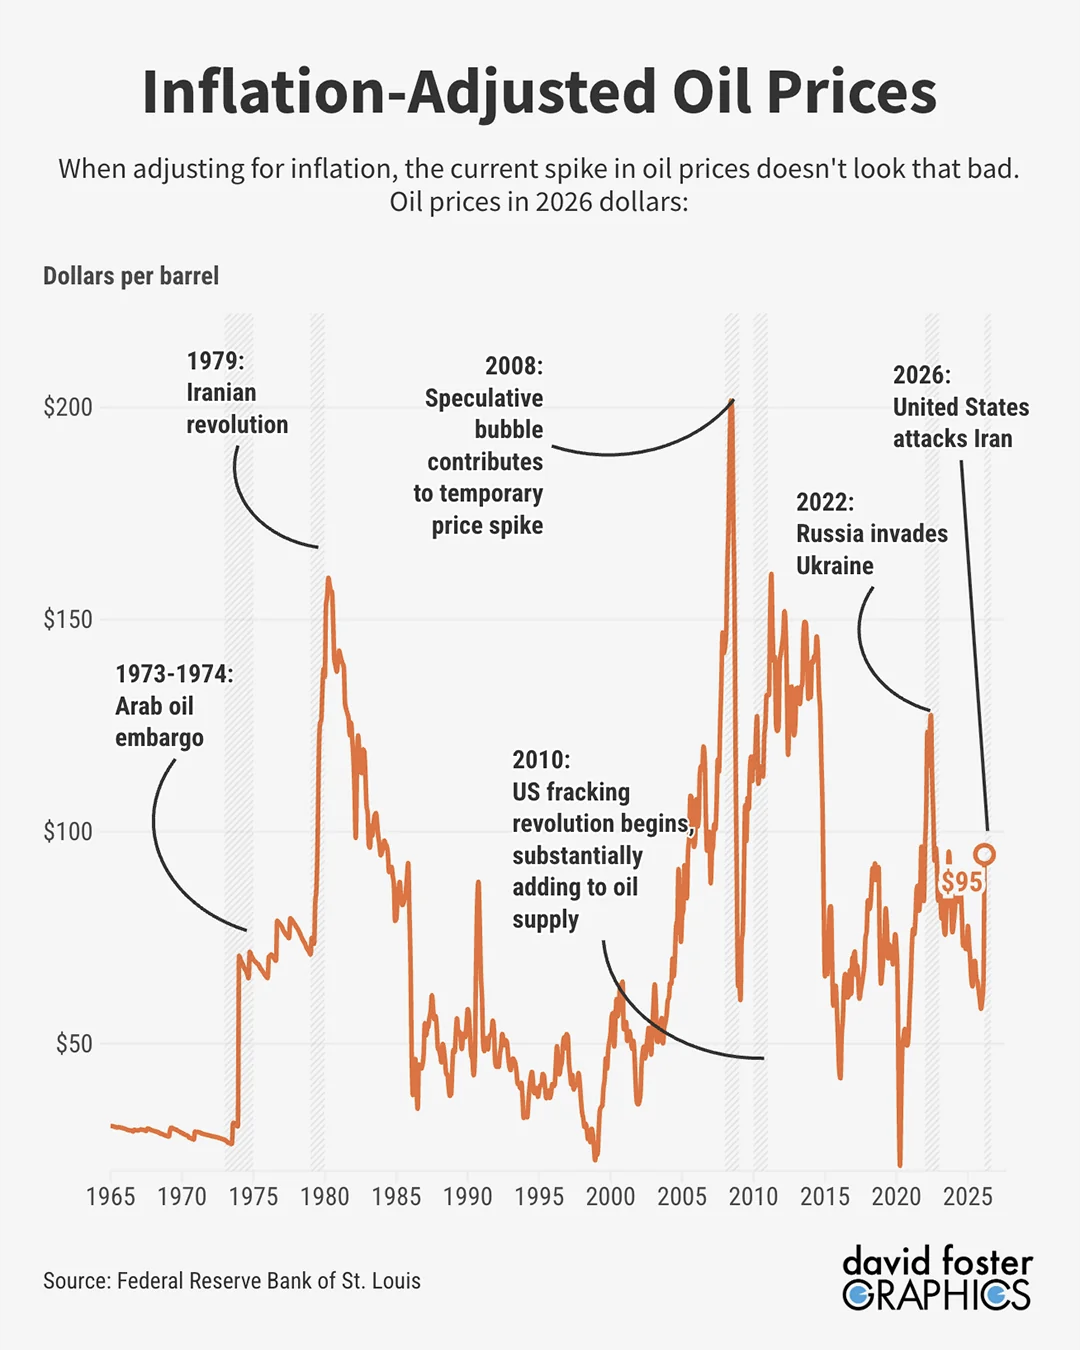
Figure 2. Inflation-adjusted oil prices, 1965-2026 (dollars per barrel, 2026 dollars), with major geopolitical events annotated. Source: Federal Reserve Bank of St. Louis (2026).
The 2026 episode illustrates both the severity and the limits of energy-market transmission. Brent crude opened 2026 at approximately US$61 per barrel and closed the first quarter at approximately US$118 per barrel following military action in the region and the de facto closure of the Strait of Hormuz, the largest quarterly increase on an inflation-adjusted basis in the series maintained since 1988 (United States Energy Information Administration, 2026). Even so, once adjusted for inflation, that peak remains materially below the 1979-1980 shocks, whose peak nominal price of roughly US$36 per barrel is equivalent to approximately US$160 in 2026 dollars. Two implications follow for the present study. First, this cautions against overstating the uniqueness of current energy volatility relative to historical episodes. Second, it highlights that the post-2010 fracking-driven expansion in United States supply structurally dampened the price impact of subsequent geopolitical shocks by diversifying the global supply base, an early example of the diversification dynamic explored further in Section 5.3.
C. Diversification of Agricultural Trade Away from China
Agricultural trade offers a clear sectoral illustration of the way in which firms and exporting countries respond to sustained tariff and trade-policy tension. Figure 3 compares the change in United States agricultural exports to China against the change in United States agricultural exports to the rest of the world, for the January to July period, comparing 2025 with 2024, across major commodities.
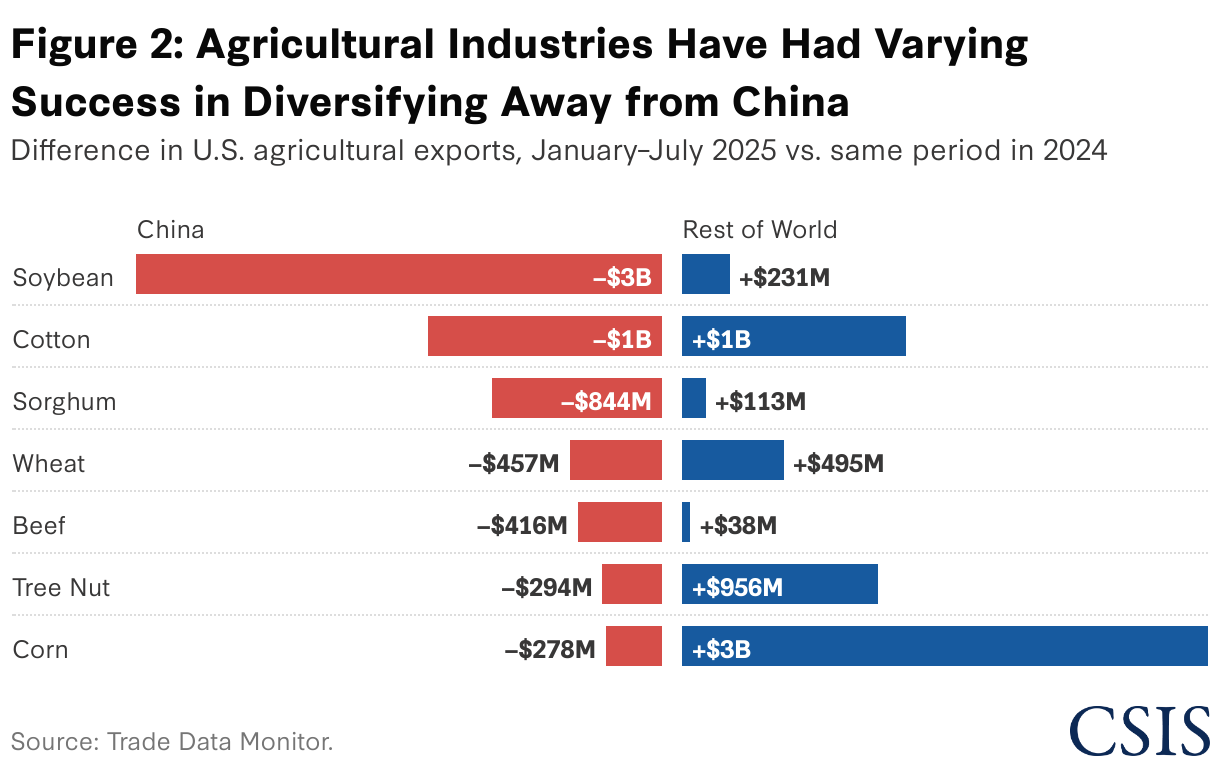
Figure 3. Change in United States agricultural exports to China compared with the rest of the world, January to July 2025 against the same period in 2024, by commodity. Source: Trade Data Monitor, as analysed by the Center for Strategic and International Studies (2025).
The data reveal sharply uneven diversification outcomes across commodities. Soybean exports to China collapsed to virtually nothing over the period, and although exports to the rest of the world rose, the increase only partially offset the loss, underscoring the difficulty of fully replacing a market of China's scale for a bulk commodity. China's share of United States soybean exports fell to approximately 18.7 per cent in 2025, a decline of some twenty-eight percentage points, with the European Union, Mexico, Egypt, Japan, and Indonesia absorbing part of the displaced volume (Monaco et al., 2025). The corn and cotton sectors adjusted most successfully, redirecting a substantial proportion of lost Chinese demand to alternative buyers. Beef and sorghum exporters, by contrast, were unable to recoup their losses elsewhere: monthly beef exports to China fell by more than ninety per cent, and China purchased no United States corn, wheat, or sorghum at all during 2025 (Center for Strategic and International Studies, 2025). This pattern supports the broader finding that geopolitical and tariff-driven trade disruption does not automatically translate into successful diversification. The ease of finding alternative buyers varies by commodity, depending on global demand elasticity, the availability of substitute suppliers, and the specificity of the quality or logistics requirements tied to the original market.
D. United States Agricultural Trade Balance Under Sustained Strain
The cumulative effect of tariff disputes and shifting trade patterns can be observed in the long-run trajectory of the United States agricultural trade balance. Figure 4 presents United States agricultural exports and imports, in billions of dollars, for fiscal years 2000 through 2026, the final year being a forecast, and highlights the shift from a historic trade surplus to a historic deficit.
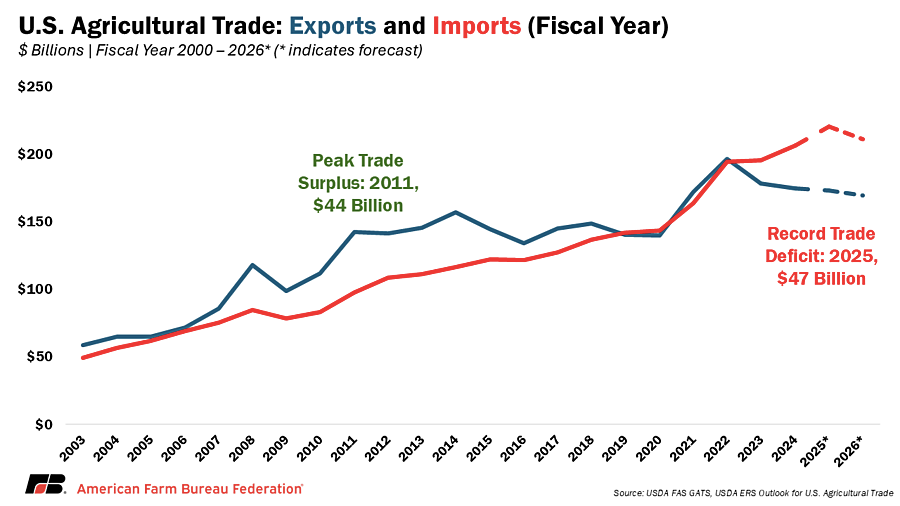
Figure 4. United States agricultural trade: exports and imports, fiscal years 2000-2026 (2026 forecast), in US$ billions. Source: American Farm Bureau Federation; United States Department of Agriculture, Foreign Agricultural Service (FAS) GATS and Economic Research Service (ERS), Outlook for U.S. Agricultural Trade.
The chart shows the United States recording its peak nominal agricultural trade surplus of approximately US$43.1 billion in fiscal year 2014, on exports of about US$152.3 billion against imports of about US$109.2 billion, followed by a long-run erosion of that surplus over the subsequent decade. The country moved into agricultural trade deficit in fiscal year 2022, and the deficit widened from US$16.7 billion in fiscal year 2023 to US$31.8 billion in fiscal year 2024 and to a record US$43.7 billion in fiscal year 2025 (American Farm Bureau Federation, 2025). That swing of roughly US$87 billion across eleven fiscal years reflects the combined effect of retaliatory tariffs on United States agricultural exports during successive trade disputes, rising import volumes of high-value and out-of-season produce, and the gradual loss of export market share to competing exporting nations that were not subject to the same retaliation.
The forecast year shown in Figure 4 qualifies that trajectory in an important respect. The USDA Economic Research Service outlook of February 2026 projects fiscal year 2026 agricultural exports of US$174.0 billion against imports of US$203.0 billion, implying a deficit of approximately US$29.0 billion, a marked narrowing from the fiscal year 2025 record and a downward revision from the US$37 billion projected in December 2025 (United States Department of Agriculture, 2026). That narrowing should be read with caution, because through the first four months of 2026 it was driven principally by a contraction in imports of about 11.5 per cent rather than by robust export growth of about 5.5 per cent (Southern Ag Today, 2026). Subject to that caveat, the trend illustrated in Figure 4 remains a longer-horizon confirmation of the commodity-level disruption shown in Figure 3: sustained geopolitical and trade-policy tension can convert a structural trade surplus into a structural deficit within a single business cycle, and the correction of that deficit is neither automatic nor necessarily benign.
E. India's Tariff Trajectory and Strategic Export Repositioning
Not all countries experience geopolitical trade tension purely as a cost. Figure 5 traces India's evolving tariff exposure and export strategy through 2026. It contrasts the pre-2026 "tariff wall" period, in which Indian exports faced peak United States tariffs of up to 50 per cent and European Union most-favoured-nation duties of roughly 9.6 to 12 per cent on categories such as textiles and apparel (Economic Laws Practice, 2026), with the 2026 "twin deal reset" produced by the interim United States framework and the conclusion of an India-European Union free trade agreement.
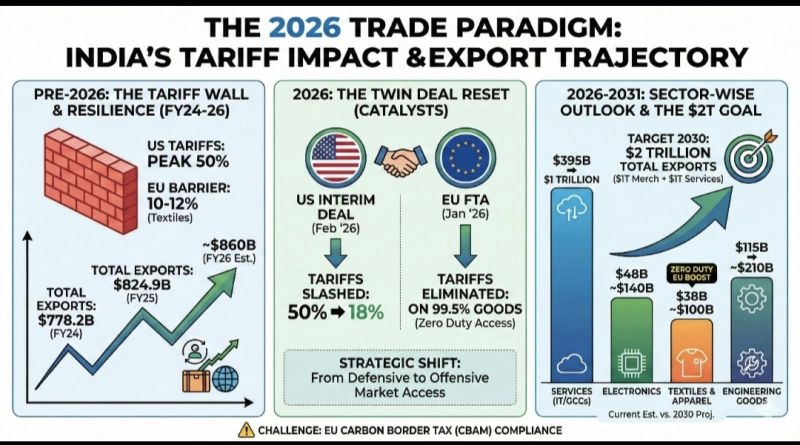
Figure 5. India's tariff impact and export trajectory: the pre-2026 tariff wall compared with the 2026 twin-deal reset, with a 2026-2031 sector-wise outlook toward a US$2 trillion export goal.
The United States leg of that reset has proved unusually unstable, and it illustrates the paper's central theme rather more forcefully than a simple narrative of tariff relief would. The United States imposed a 25 per cent tariff on Indian goods with effect from 1 August 2025 and doubled it to 50 per cent with effect from 27 August 2025, the additional increment being tied to India's continued purchases of Russian crude oil. On 2 February 2026 the two governments announced an interim framework under which the reciprocal component was to be reduced and the oil-linked increment removed, taking the headline rate to approximately 18 per cent (White House, 2026). On 20 February 2026, however, the Supreme Court of the United States held by six votes to three that the International Emergency Economic Powers Act does not authorize the President to impose tariffs, striking down the reciprocal tariff programme on which the 18 per cent figure rested (Congressional Research Service, 2026). The Administration responded with a proclamation imposing a global surcharge of 10 per cent under Section 122 of the Trade Act of 1974, effective 24 February 2026, an authority available only in a balance-of-payments emergency and only for 150 days absent congressional extension. That surcharge lapsed by operation of law on 24 July 2026 and was replaced, on the same day, by duties of 10 to 12.5 per cent imposed under Section 301 on products from some eighty countries, an authority carrying no statutory sunset (Nakachi Eckhardt and Jacobson, 2026). The applicable rate on Indian goods as at the date of writing therefore derives from the Section 301 measure rather than from the February framework, and the position should be verified afresh before reliance is placed upon it.
The European Union leg has proved more durable. Negotiations concluded on 26 January 2026, and the agreement was announced on 27 January 2026. On its terms the European Union grants immediate duty-free access to approximately 70.4 per cent of tariff lines, covering more than 90.7 per cent of India's export value to the bloc, rising to approximately 99 per cent of Indian exports on full implementation, with the existing duties of up to about 12 per cent on labour-intensive lines such as textiles, apparel, leather, footwear, marine products, gems and jewellery, and engineering goods falling to zero on entry into force (European Commission, 2026). It should be emphasized that the agreement had been concluded but had not yet entered into force at the time of writing; implementation is expected to follow ratification, and the tariff outcomes described here are prospective rather than operative.
Against that background, India's total exports reached a record US$860.09 billion in the financial year 2025-26, comprising merchandise exports of US$441.78 billion and services exports of US$418.31 billion. The same outlook envisions a sector-wise expansion spanning services, electronics, textiles, and engineering goods, intended to lift total exports toward a US$2 trillion target by 2030-31, with merchandise and services each contributing approximately US$1 trillion (Ministry of Commerce and Industry, 2026). That trajectory coexists with emerging compliance considerations, most prominently the European Union's Carbon Border Adjustment Mechanism (CBAM), whose definitive regime commenced on 1 January 2026 and which applies to imports irrespective of preferential tariff treatment. The India-European Union agreement addresses this through a dedicated CBAM annexure setting out a compliance roadmap and simplified procedures for small and medium enterprises, but the underlying tension between tariff liberalization and climate-related cost equalization remains unresolved for carbon-intensive lines such as iron and steel, aluminium, and certain chemicals. Figure 5 accordingly illustrates a broader theme running through this paper: countries that diversify their trade-agreement network and move quickly to formalize preferential access with alternative partners can convert geopolitical tension into a strategic opening, even as they continue to manage new forms of regulatory and compliance risk, and even as the legal foundations of their counterparts' tariff measures remain contested.
F. Services Trade Case Study: India and Thailand
To complement the goods-focused and commodity-focused evidence set out above, Table 1 presents a sector-level breakdown of India's commercial services exports to Thailand in 2023, illustrating the composition of a bilateral services relationship that is comparatively insulated from tariff-based disputes but is nonetheless shaped by regional trade policy and by connectivity.
Table 1. India's commercial services exports to Thailand, by sector, 2023 (US$ million and percentage share of total commercial services). Reporter: India; partner: Thailand; direction: exports (credits). Source: Organisation for Economic Co-operation and Development and World Trade Organization, Balanced Trade in Services database (BaTIS), BPM6 edition.
[TABLE 1 INSERT POINT. Reproduce the author's Word table here, with the two corrections noted below. Content as corrected:] Sector | Value (US$ million) | % Share Transport | 366 | 14.57% Sea transport | 187 | 7.44% Air transport | 129 | 5.14% Other modes, postal and courier services (residual) | 50 | 1.99% Travel | 332 | 13.22% Business travel | 23 | 0.92% Personal travel | 309 | 12.30% Telecommunications, computer and information services | 474 | 18.87% Computer services | 456 | 18.15% Telecommunications and information services (residual) | 18 | 0.72% Other business services | 1,118 | 44.51% Professional and management consulting services | 685 | 27.27% Technical and trade-related services | 420 | 16.72% Research and development services (residual) | 13 | 0.52% Construction | 81 | 3.22% Insurance and pension services | 28 | 1.11% Financial services | 51 | 2.03% Charges for the use of intellectual property n.i.e. | 41 | 1.63% Other commercial services not separately shown | 21 | 0.84% Total commercial services | 2,512 | 100.00%
Two points of construction should be noted. First, the eight top-level categories reported in the author's original table sum to US$2,491 million against a stated total of US$2,512 million. The residual of US$21 million, or 0.84 per cent, is not an error in the total, which is confirmed by the fact that every percentage share in the table is computed correctly against a denominator of 2,512. It is attributable to the top-level categories of the Extended Balance of Payments Services Classification (EBOPS 2010) that the original table omitted, namely manufacturing services on physical inputs owned by others, maintenance and repair services n.i.e., and personal, cultural and recreational services. Government goods and services n.i.e. is excluded by definition from the commercial services aggregate and therefore does not account for the gap. Secondly, three of the sub-category breakdowns are likewise incomplete against their own parent totals, and the residual lines shown above have been added so that each group reconciles.
The data show that other business services, dominated by professional and management consulting together with technical and trade-related services, account for the largest share of India's commercial services exports to Thailand, at approximately 44.5 per cent of the total. Telecommunications, computer and information services, driven overwhelmingly by computer services, form the second-largest category at close to 18.9 per cent, followed by transport at 14.6 per cent and travel at 13.2 per cent. This composition indicates that India's services exports to Thailand are concentrated in knowledge-intensive, digitally deliverable categories that are less exposed to the tariff and logistics disruptions documented in the goods-trade evidence set out above. It suggests, in turn, that services trade may offer a partial buffer against goods-trade volatility for economies able to expand their services export base.
Findings of the Study
Geopolitical tensions significantly disrupt global trade flows. The effects are measurable in regional GDP projections, in sectoral export volumes, and in long-run trade balances.
Supply chain effects go beyond the simple redirection of trade. The agricultural evidence shows that disrupted flows are not always fully replaced by new buyers, producing delays, shortages, and net export contraction in several commodities.
Trade barriers such as tariffs and sanctions have increased over the period studied. The 2026 India-United States and India-European Union developments nonetheless illustrate that tariff regimes can be renegotiated relatively quickly once the underlying diplomatic conditions change.
The legal foundation of unilateral tariff measures is itself a source of volatility. The invalidation of the United States reciprocal tariff programme in February 2026, and its replacement by two successive alternative statutory authorities within six months, shows that firms must now price legal risk alongside political risk.
Business uncertainty linked to geopolitical tension leads to reduced or delayed investment. This pattern is consistent with the growth slowdown depicted in the Asia-Pacific projections.
Prices of goods, and particularly of energy, are sensitive to geopolitical shocks. The inflation-adjusted historical record nonetheless suggests that recent spikes are less extreme than earlier crises once inflation and expanded supply sources are taken into account.
Countries are shifting towards regional and preferential trade agreements. India's twin-deal reset with the United States and the European Union is illustrative.
Developing nations are more vulnerable to economic shocks in commodity and goods trade. They can nonetheless benefit disproportionately from successful diversification and from new market-access agreements, as the Indian case demonstrates.
Services trade appears comparatively insulated from the tariff-driven disruption documented in goods and agricultural trade. This suggests a potential diversification pathway for exposed economies.
Discussion
Taken together, the evidence presented in Section 5 supports a nuanced view of the relationship between geopolitical tension and international trade. On the one hand, the findings confirm the conventional expectation that tension raises costs. Growth projections soften, agricultural exporters lose market share that is not always recovered elsewhere, and long-run trade balances can swing from surplus to deficit within little more than a decade. These effects are consistent with the problem statement outlined in Section 1.2: disrupted supply chains, higher trade barriers, sanctions-driven relationship breakdowns, elevated uncertainty, and price inflation are all visible in the data reviewed here.
On the other hand, the same body of evidence complicates any narrative of straightforward decline. The historical oil-price record shows that today's shocks, while significant, are not unprecedented once inflation is taken into account, and that expanded supply diversity, illustrated by the post-2010 fracking-driven supply growth, can materially dampen the transmission of future shocks. Similarly, India's 2026 tariff trajectory demonstrates that a country exposed to elevated tariffs can, through active diplomacy and trade-agreement renegotiation, convert a defensive position into an offensive one within a relatively short window, opening near-total duty-free access to a major market. The volatility of the United States leg over the same period is an equally instructive counterpoint: a negotiated rate that rested on a contested statutory basis was displaced within weeks by judicial decision, and the measure that succeeded it lapsed by statute within five months. The impact of geopolitical tension on trade is therefore not simply a function of exposure. It is also a function of the speed and effectiveness of a country's or a firm's policy and strategic response, and of the durability of the legal instruments through which trade measures are imposed.
The uneven diversification results in agricultural trade shown in Figure 3 further suggest that resilience is not uniform across sectors even within the same economy. Bulk commodities facing few alternative large buyers, such as soybeans, and quality-differentiated products tied to a single market, such as beef, remain structurally exposed, whereas corn and cotton adjusted comparatively well and services, as illustrated by the India-Thailand case study, appear better insulated still, being less dependent on physical logistics and less subject to tariff schedules. This has a direct implication for the AI-enabled supply chain theme developed in this paper. Digital and knowledge-intensive trade may represent both a diversification opportunity and a natural complement to efforts to build more resilient, technologically enabled supply chains, since data and service flows can be rerouted with considerably more flexibility than physical shipments of bulk commodities.
Conclusion
Geopolitical tensions have a strong and often negative impact on international trade. They disrupt supply chains, increase trade barriers, and create economic uncertainty, as demonstrated across the growth, energy, agricultural, and bilateral trade-balance evidence reviewed in this paper. While these challenges affect all countries, developing nations are particularly vulnerable to commodity-price and sanctions-driven shocks, given their comparatively lower capacity to absorb sudden shifts in market access or in input costs.
Such tensions also encourage countries to adapt, however, by diversifying trade partners, renegotiating preferential access, and strengthening domestic industries. The Indian case examined in this paper illustrates how a country can move from a defensive tariff posture to an offensive market-access strategy within a single year through decisive trade diplomacy, while also illustrating how quickly the legal basis of a counterpart's tariff measures can shift beneath a negotiated settlement. Effective policies, international cooperation, and strategic planning, including the diversification of supply chains, the strengthening of regional trade agreements, and the calculated expansion of digitally deliverable services trade, are essential if risks are to be minimized and the stability of global trade ensured as the world moves through the current period of "Great Re-globalization".
Suggestions and Policy Recommendations
Countries should diversify their trade partners rather than depending on a small number of large export or import markets, particularly for commodities shown to have limited alternative buyers.
Governments should strengthen regional trade agreements and preferential access arrangements, following the model of rapid tariff renegotiation illustrated by the 2026 India-United States and India-European Union developments, while ensuring that the resulting instruments rest on durable legal foundations.
Firms and governments should jointly invest in improving supply chain resilience, including dual-sourcing and multi-sourcing strategies, buffer inventories for critical inputs, and artificial-intelligence-enabled logistics and demand forecasting.
Diplomatic solutions to conflicts should be actively promoted, given the demonstrated capacity of diplomacy to reverse tariff escalation within a short time frame.
Countries should encourage self-reliance and domestic production in strategically sensitive sectors, while remaining mindful of the efficiency costs of excessively inward-looking policy.
Exporting economies should consider expanding services and digitally deliverable trade as a complement to goods trade, given its comparative insulation from tariff-driven disruption.
Firms should closely monitor emerging non-tariff and regulatory measures, such as carbon border adjustment mechanisms, which may reshape trade costs even where traditional tariff barriers are falling.
Limitations and Future Scope
This study is subject to several limitations that also point toward productive directions for future research. The analysis rests entirely on secondary data; future research can incorporate primary data collection through surveys of, or interviews with, trade and logistics practitioners, so as to capture firm-level decision-making that published statistics cannot reveal. The study also takes a broad, cross-sectoral view, and future work can usefully focus on specific industries such as oil and energy, semiconductor and technology supply chains, or agriculture, in order to develop more granular, sector-specific policy recommendations. The analysis is further limited to the period for which data were available at the time of writing, and the tariff position described in Section 5.5 in particular has changed several times within a single year; a longer-term study tracking the effects of geopolitical tension over multiple business cycles would help to distinguish transitory disruption from structural realignment. Finally, given the growing share of trade conducted through digital channels, future research should examine more closely the impact of geopolitical tension on digital trade and electronic commerce, an area touched upon only briefly in the services trade case study presented here.
*****
- American Farm Bureau Federation. (2025). U.S. heading to record ag trade deficit [Market Intel]. https://www.fb.org/market-intel/u-s-heading-to-record-ag-trade-deficit
- Center for Strategic and International Studies. (2025, October 21). When a trade war becomes a food fight. https://www.csis.org/analysis/when-trade-war-becomes-food-fight
- Congressional Research Service. (2026). Supreme Court rules against tariffs imposed under the International Emergency Economic Powers Act (IEEPA) (Legal Sidebar No. LSB11398). https://www.congress.gov/crs-product/LSB11398
- Economic Laws Practice. (2026, March). India-EU FTA update [Trade update]. https://elplaw.in/wp-content/uploads/2026/03/India-EU-FTA-Update.pdf
- European Commission. (2026, January 27). EU and India conclude landmark Free Trade Agreement [Press release IP/26/184]. https://ec.europa.eu/commission/presscorner/detail/en/ip_26_184
- Federal Reserve Bank of St. Louis. (2026). Global price of Brent Crude (Series POILBREUSDM) [Data set]. FRED. https://fred.stlouisfed.org/series/POILBREUSDM
- International Monetary Fund. (2023). Geo-economic fragmentation and the future of multilateralism (Staff Discussion Note No. SDN/2023/001). https://www.imf.org/-/media/files/publications/sdn/2023/english/sdnea2023001.pdf
- Ministry of Commerce and Industry, Government of India. (2026, January 27). India-EU Free Trade Agreement concluded. https://www.commerce.gov.in/files/2026-02/India-EU%20Free%20Trade%20Agreement%20Concluded%20dated%2027.01.2026.pdf
- Monaco, L., Colussi, J., & Langemeier, M. (2025, December 15). U.S. corn and soybean exports: Diversification drives growth in corn and cushions decline in soybeans. Farmdoc Daily, 15(230). https://farmdocdaily.illinois.edu/2025/12/us-corn-and-soybean-exports-diversification-drives-growth-in-corn-and-cushions-decline-in-soybeans.html
- Moody's Analytics. (2026, July 31). Asia-Pacific outlook: Regional growth to moderate to 4.1% in 2026. https://upstox.com/news/business-news/economy/growth-in-asia-pacific-region-likely-to-moderate-to-4-1-in-2026-moody-s/article-197924/
- Nakachi Eckhardt and Jacobson. (2026, July 4). Section 122 global surcharge sunsets July 24: What importers should do before, and after, the 150-day clock runs out. https://www.tradelawcounsel.com/insights-news/2026/7/4/section-122-surcharge-sunsets-july-24-what-importers-should-do-beforeand-afterthe-150-day-clock-runs-out
- Organisation for Economic Co-operation and Development & World Trade Organization. (2025). The OECD-WTO Balanced Trade in Services database (BaTIS), BPM6 edition, 2005-2023 [Data set]. https://www.wto.org/english/res_e/statis_e/gstdh_batis_e.htm
- Southern Ag Today. (2026, June 18). A narrowing agricultural trade deficit in 2026: But are we better off? https://southernagtoday.org/2026/06/18/a-narrowing-agricultural-trade-deficit-in-2026-but-are-we-better-off/
- United States Department of Agriculture, Economic Research Service. (2026, February). Outlook for U.S. agricultural trade (Report No. AES-135). https://www.ers.usda.gov/publications/pub-details?pubid=113911
- United States Energy Information Administration. (2026). Crude oil and petroleum product prices increased sharply in the first quarter of 2026. Today in Energy. https://www.eia.gov/todayinenergy/detail.php?id=67424
- White House. (2026, February 6). Fact sheet: The United States and India announce historic trade deal. https://www.whitehouse.gov/fact-sheets/2026/02/fact-sheet-the-united-states-and-india-announce-historic-trade-deal/
- World Trade Organization. (2023). Is the global economy fragmenting? (Staff Working Paper No. ERSD-2023-10). https://www.wto.org/english/res_e/reser_e/ersd202310_e.htm
- World Trade Organization. (2026, March). Global trade outlook and statistics: March 2026. https://www.wto.org/english/res_e/booksp_e/gtos0326_e.pdf